I wrote a blog post about cryptocurrency market cycles and how to time the crypto market but what you have to realize is that these cycles are primarily initiated by Bitcoin’s halving imo. After halving happens, buyer’s momentum takes place and new price discovery happens. Then you know how it goes, bull market doesn’t end until last sceptic is convinced that he should put his money in Bitcoin. Same is with bear market, it lasts until last bull gives hope for a better days.
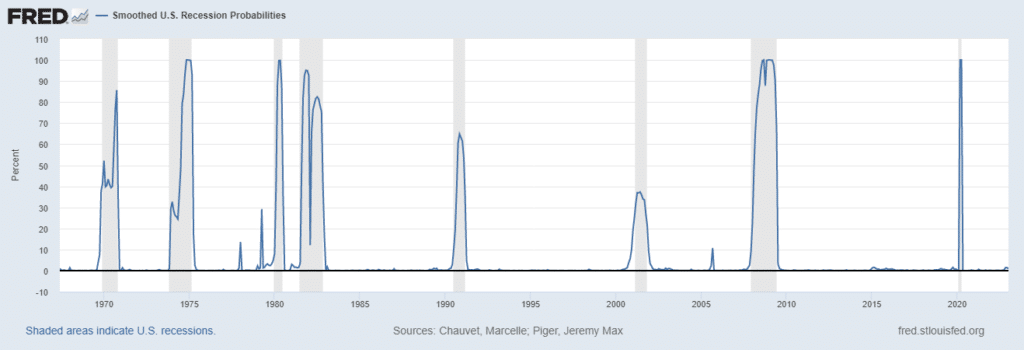
This is internal mechanism of the boom and bust cycle that followed cryptocurrencies so far. First time crypto as asset class is not operating in overall bull market. Last economic expansion was probably longest so far, or second longest. These grey areas represent recessions, in between are economic expansions.
Cycles are something that people noticed long time ago.
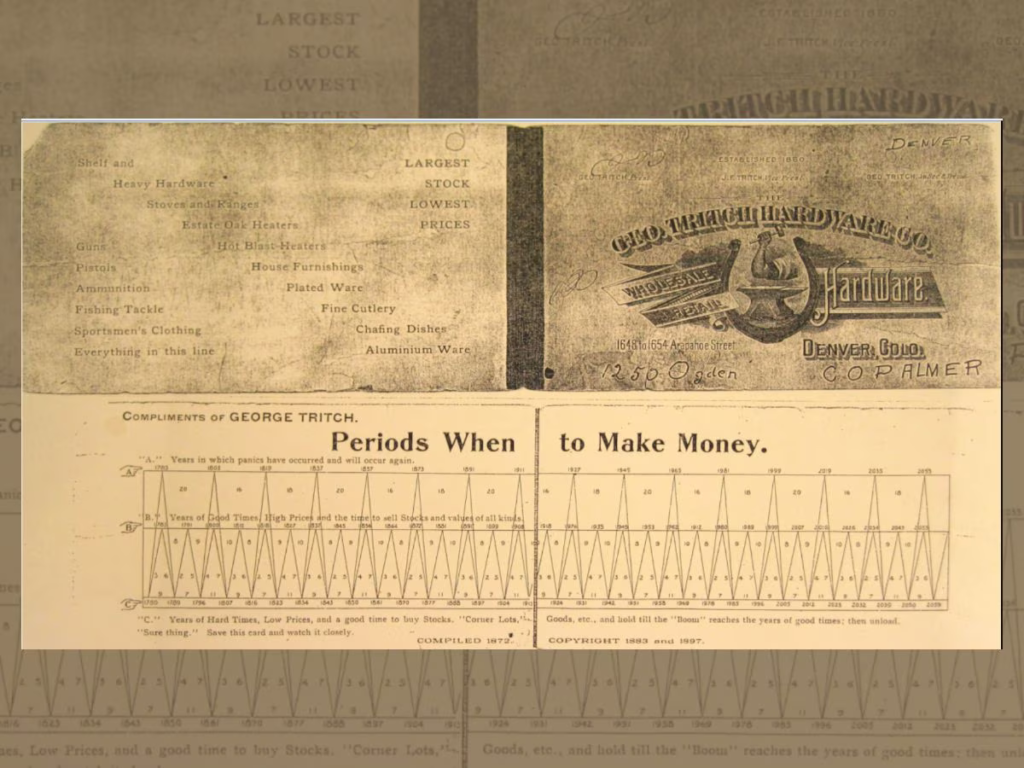
This chart is from the book printed in 1875 from Samuel Benner, an Ohio farmer. Name of the book is “Benners Prophecies: Future Ups And Down In Prices.” As Benner said it was to inform others on how to make “money on pig iron, corn, hogs, and cotton.” It is said that Samuel Benner was a wealthy farmer who was wiped out financially by the 1873 panic. He discovered a high degree of cyclicality in his search for the reasons behind market changes.
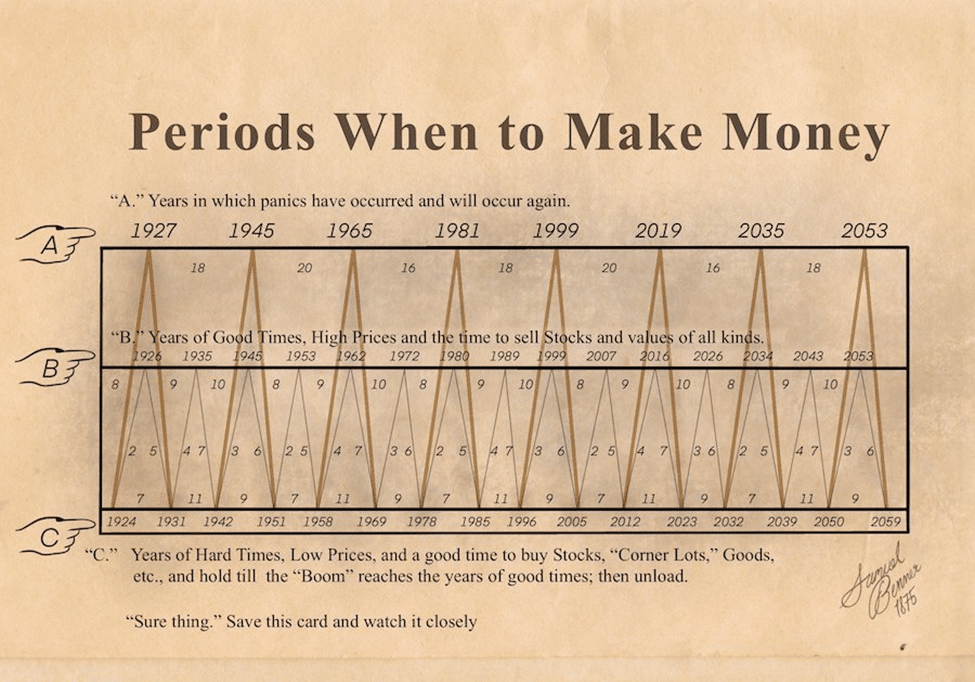
What is amazing is how it until today shows how this analysis is amazingly accurate. It shows periods of panic, good time to sell assets and good times to buy. If you look at the top row it actually predicted great depression, WW2, dot com bubble and the COVID crash which we recently went through. Kind of mind blowing.
There are even Kondratiev’s waves which are describing how often big technological life cycles emerges.
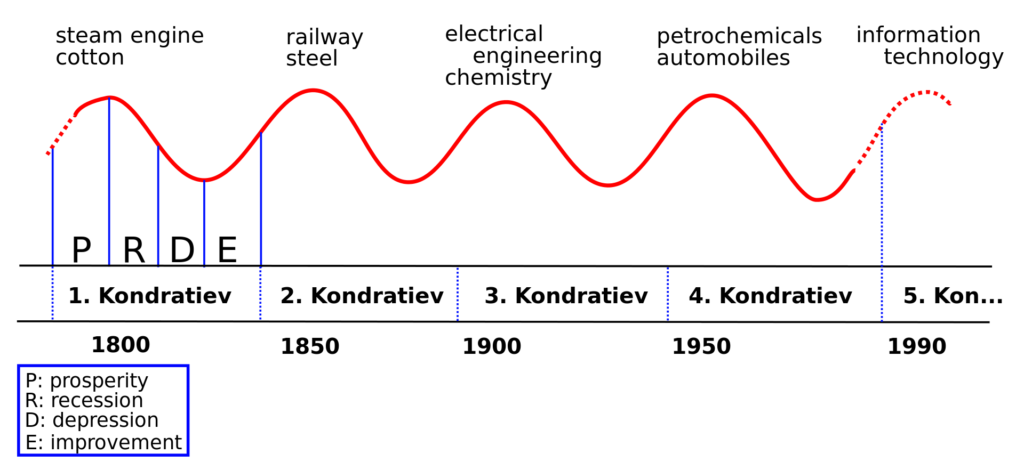
Fun fact: Josef Stalin asked Nikolai Kondratiev to forecast when all the enemy (i.e. capitalist) economies would collapse because it was widely considered, certainly by Stalin and others, that Communism was about to take over the world. Stalin needed to be prepared. Nikolai was to work out when that would happen and to give a bit of a heads up to those in power in Russia.
Even the ancient Jews were aware of cycles, and that is why they made laws where debt is forgiven. Every 7 years, if you were in debt, on 8th year you would be debt free. And it did not stop there. Every 50 years if you and your family had something of value like land which was taken away from you because you could not pay debt, it was given back to original owner. If there were slaves, after 50 years they were becoming free.
As we can conclude, resets and wild swings are totally normal and expected when you think about it. Ancient Chinese described cycles as Yin and Yang which are two stages of a cycle that consistently change into the other.
But we will stick to economic cycles. What I will explain you is what I learned from mainly Mike Maloney and I am using some of his slides. He is a real gold bug, but he also understands cycles and is looking at economy from macro perspective.
There’s only so many different asset classes, and I’ve picked the three major ones:
Paper assets, like stocks and bonds
Real estate
Commodities, which include precious metals (and cryptocurrencies).
But precious metals are a little bit different than the rest because they’re also money (not currency!). They’re a safe-haven asset in times of crisis. There are some times when commodities can be going down, but precious metals go up.
Precious metals outperformed real estate and stocks but everything went up. Stocks went up, bonds went up, real estate went up and so did commodities and precious metals.
Is that possible? Can everything go up?
Think about it for a minute. If we’ve only got so much stuff in society and if you’ve got these 3 or 4 asset classes and everybody rushes toward one, pushing it to a bubble shouldn’t it be drawing value away from the others? Shouldn’t the others be going down?
Yes they should. Except we live in a world where banks are constantly creating currency and everybody is getting a little bit of this newly generated currency, and there is always someone who is buying some assets in all asset classes. So instead of the things that are being undervalued falling, they either go sideways or they increase just a little bit, as the one asset class is going into a bubble, because of all of this currency creation.
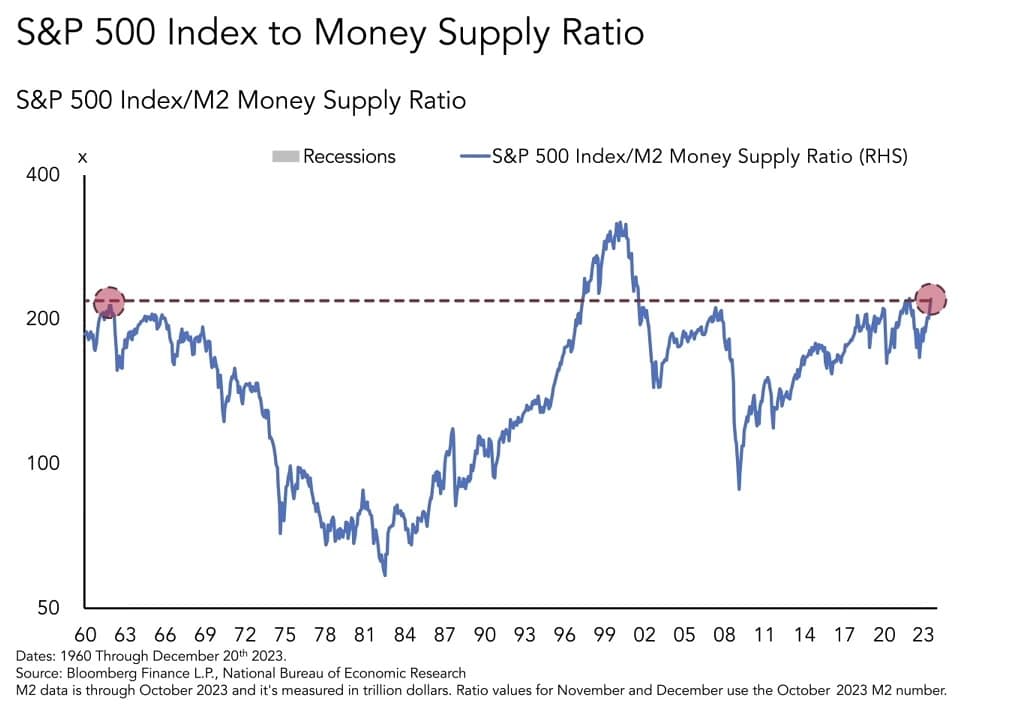
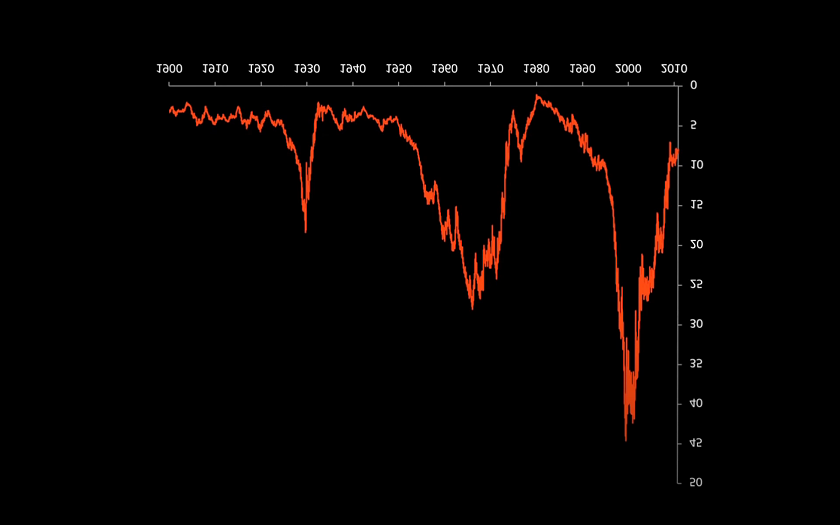
To illustrate this, the market is actually at the same level as 1960 when adjusted for M2 money supply
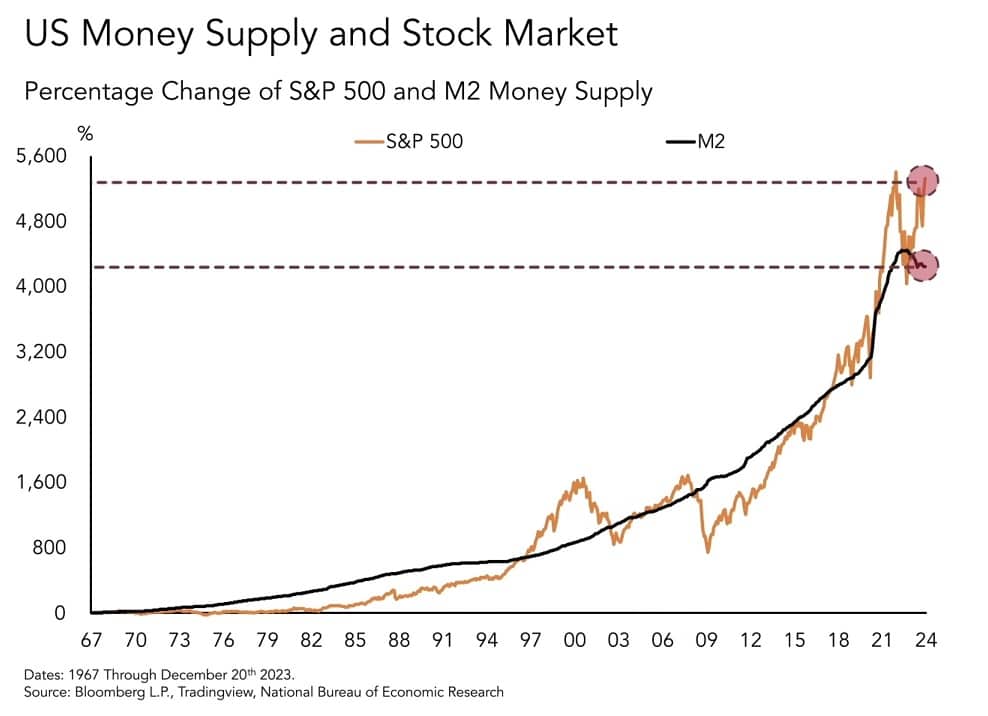
The stock market’s rise mirrors the money supply’s growth since 1970, both expanding by over 4,500%
As we can see, S&P 500 valuation is tracking money supply, but it also oscillates around the money supply line. These oscillations (booms and busts) are happening because of economic cycles.
This is the typical pattern of an economic cycle. It has 4 stages:
- Expansion
- Peak
- Contraction
- Trough
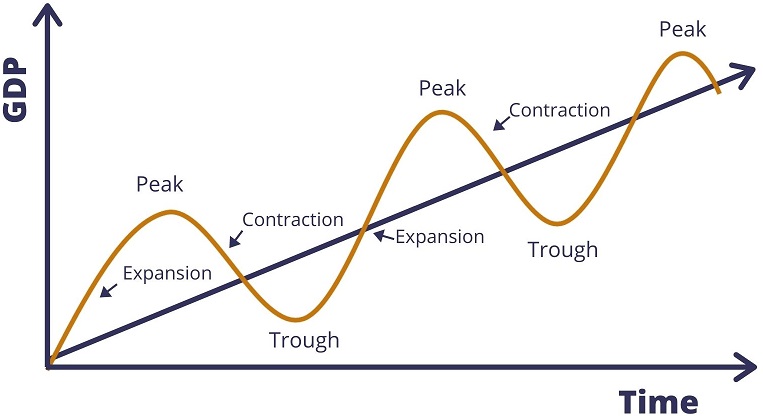
Each peak or trough is usually higher than the last, as economy expands. This is because today’s financial system is based on debt, where each currency in existence represents debt. That means no debt, no money. That’s why we have crashes and exuberances, on micro and macro levels.

This is how it looks like when you zoom out. I have a hypothesis that “leveraging part” of the cycle is taking longer and longer, as human life span increases, so that there are no living people left from last big depression to warn next generation about it. Since wealth can not be destroyed only transferred, it may be that this exists just to fuck up the middle class and transfer their wealth to the rich who are becoming even richer because they know what is going on.

But I’m not here to talk about conspiracy theories, so we will stick to the real facts and real numbers from now on. Or something that I like to call the theory of spontaneous events.
Real Estate cycles
As I said before, these cycles in economy are happening because of how currency creation works. There are times when banks are gladly offering a lot of cheap credit, and times when banks are very careful to whom they lend expensive credits.
Let’s see how cycles work in real estate – often called the mother of all bubbles.
There is this 18.6-year real estate cycle that has driven the rhythm of real estate for well over two centuries. Here’s a little bit of history about it, but before we begin, please understand that all real estate markets have local influences, and that there is no universal real estate cycle for the whole world.
History
So where does this 18.6-year cycle come from? In 1776, Adam Smith wrote a book called “The Wealth of Nations.” Actually the title was a lot longer, and it wasn’t a book; it was actually several volumes, but you get the idea.
In 1809, this guy David Ricardo was so inspired by Adam Smith’s work that he came up with his theory of economic rents.
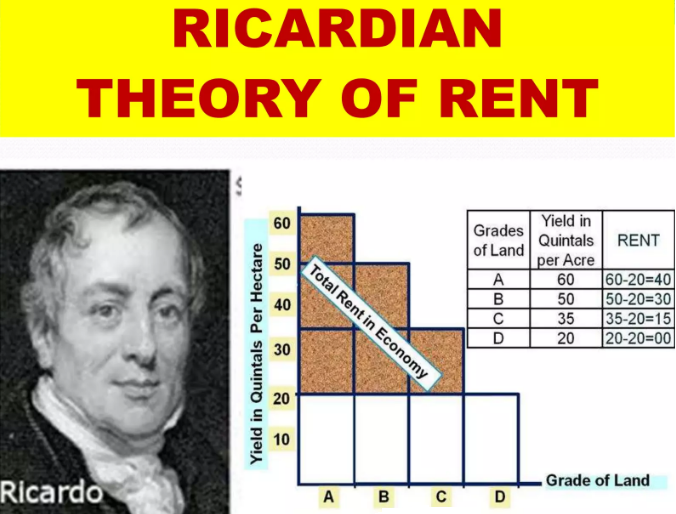
I’m no David Ricardo, but I can tell you that the theory of rents basically describes the surplus value of land given equal inputs of labor and capital. Modern-day investors think of this as locational value.
Private ownership of land is permitted through a government-granted license called title. The most fertile land or land with the greatest density carries the highest value, while the factors of production are land, labor, and capital.
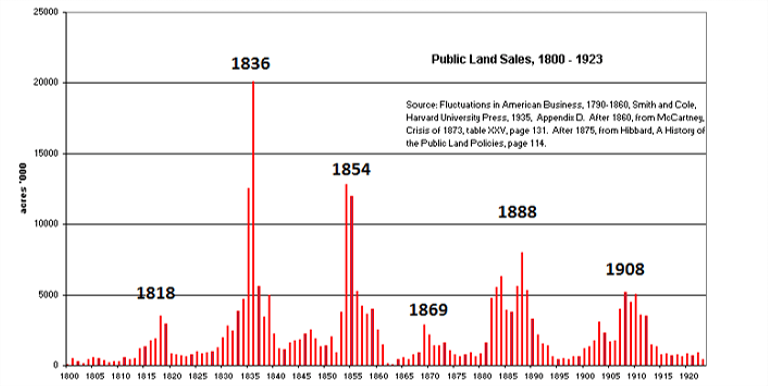
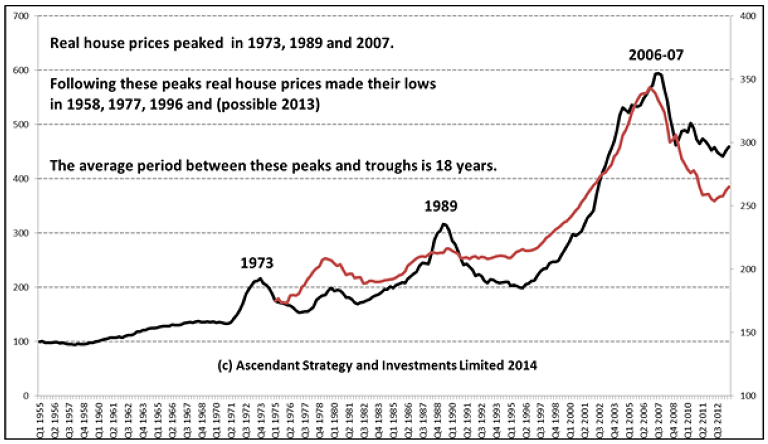
All of the benefit goes to the landowner… until it doesn’t. Eventually, the tenants can no longer afford or no longer tolerate ever-increasing rents. How often does that happen? Well, about once every 18 years, at least according to Homer Hoyt which published in 1933 “100 Years of Land Values in Chicago.”
Although he focused on the city of Chicago, it was truly representative of cities in all developed countries which proved another man around the same time, Roy Wenzlick from St. Louis. He independently assembled data from over 120 other U.S. cities, also identifying an 18-year cycle. In 1936, he published “The Coming Boom in Real Estate and What to Do About It.” It was just 48 pages in length.
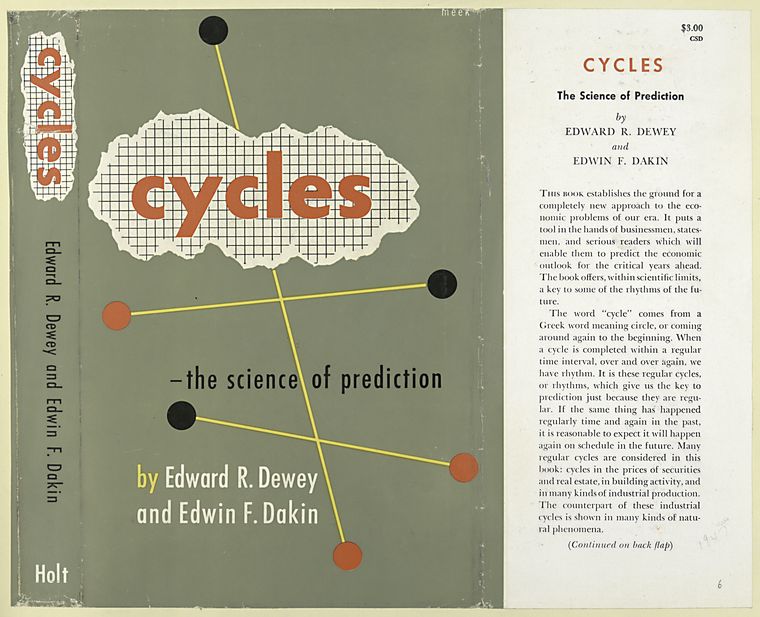
In 1947, Edward R. Dewey and Edwin F. Dakin dug deeper into understanding cycles with their work entitled “Cycles: The Science of Prediction.”
This hand-drawn chart, spanning from 1795 to 1958, is originally their work. Others have updated it to present day with remarkable rhythmic accuracy.
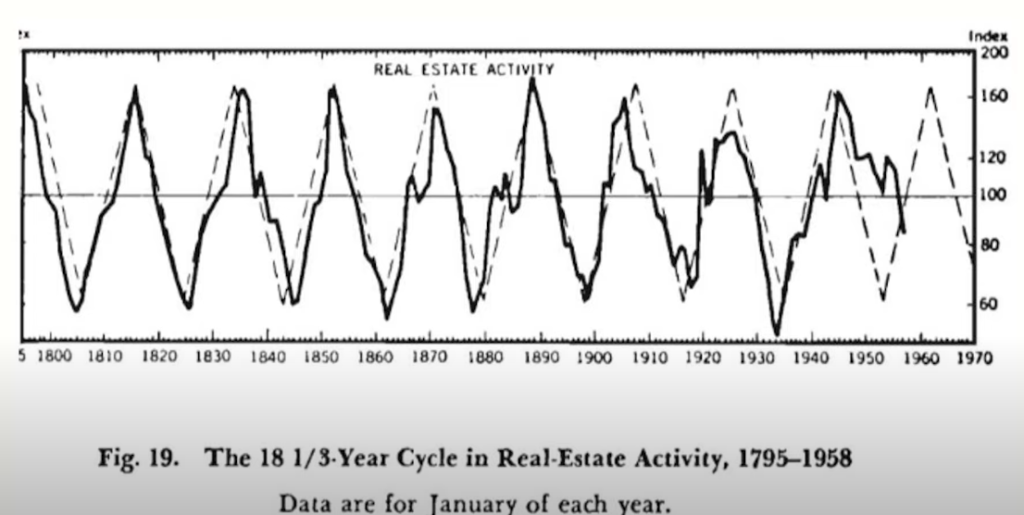
For over 200 years, real estate cycles have repeated in times of inflation or deflation, whether interest rates are high or low, with or without trade barriers, with government subsidies, and with high, low, or no taxes.
So let’s jump to present day.
Fred Harrison’s economic predictive powers relating to this 18-year cycle are well-documented in his publications: “The Power in the Land” (1983), “Boom Bust” (2005), and “Ricardo’s Law” (2006). Spoiler alert: Harrison believes our current cycle will peak right around 2026.
Here’s how the 18-year cycle works:
14 years up, interrupted by a mid-cycle dip, and then four years down.
You’ll see that when you get the crash, and it bottoms out, it bottoms out at a higher level than the starting point of the cycle. So, each cycle starts from a higher baseline than the last one. What does that mean? Well, it means that the long-term trend of prices is always upward. Because it goes up, it goes down a bit, but not as low as it was to start with. So, you get this long-term upward trend. But along the way, you get big peaks and crashes.
You’ll often hear people saying things like, “Property prices always go up; you’re safe in property because prices always go up.” And yes, that is correct. Prices do, over the long term, always go up (because of inflation though). But if you zoom in, you’ll see that they don’t just go up in a nice, smooth straight line. You get these booms, and you get these crashes along the way.
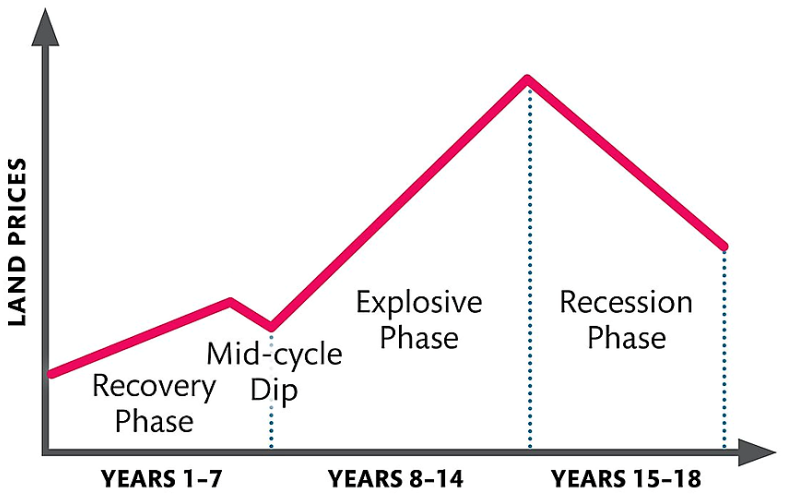
This cycle has reliably repeated itself over and over again for well over 200 years, really only ever disrupted by two world wars.
The secret to profiting from this information isn’t just understanding the cycle; it’s finding reliable ways to predict where on that cycle we might be. That’s where “The Secret Life of Real Estate and Banking,” Philip Anderson comes in handy. Philip Anderson and his organization, Property Share Market Economics, probably have the most reliable and up-to-date information on the 18.6-year cycle today. While they’re based in Australia, the focus of their work is Western economies.
Anderson says that a study of U.S. history reveals a very clear average 18.6-year cycle in credit and real estate prices measured from peak to peak or from trough to trough. That cycle has never been shorter than 17 years and never longer than 21.
If you’re paying attention, you may have noticed that I’ve talked about 18-year cycle, then an 18.3-year cycle, and now this 18.6-year cycle.
Well, it seems that over time, the cycle has been gradually, ever so gradually, growing in length, and the highs and the lows are becoming more extreme, meaning that an upcoming crash is likely to be severe.
So, where are we today? Here’s a chart from Property Share Market Economics.
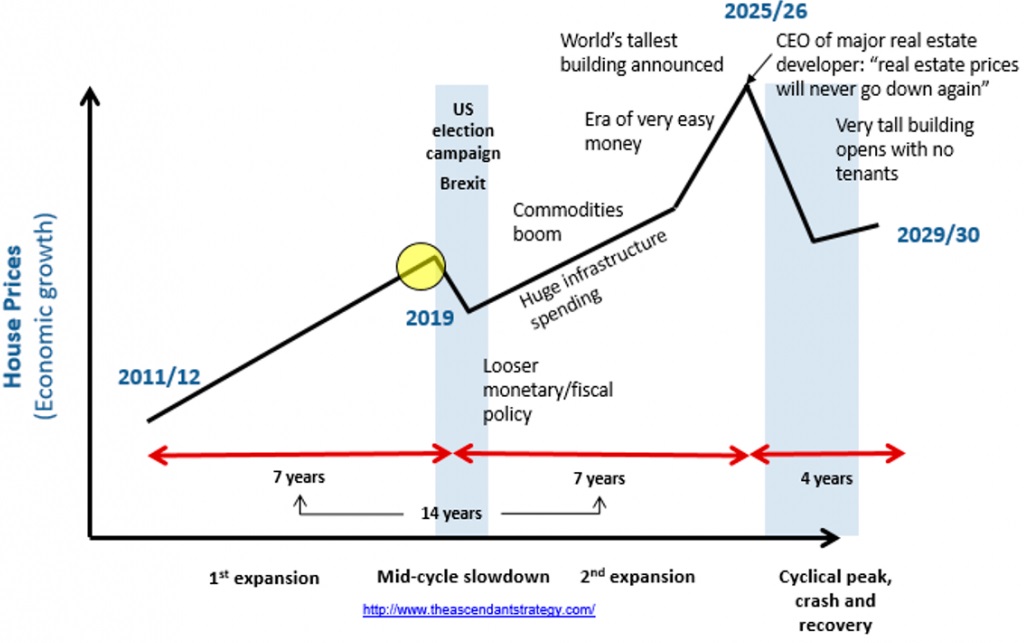
The story begins following the devastation of the Great Recession. The yellow dot represents the date this chart was published. Nobody could have predicted a pandemic. What they could have and did predict was that, like clockwork, there would be a mid-cycle slowdown. Something always causes a faltering of confidence mid-cycle. The first shaded blue area shows the U.S. election campaign and Brexit, followed by looser monetary policy and then huge infrastructure spending.
Sound familiar?
Five or so years of expansion culminate in an era of very easy money and the announcement of a new world’s tallest building. This is the way the cycle always plays out. The last part of the expansion, where the line begins to slope up dramatically, probably around 2026, is called the winner’s curse. This is when everybody knows all the problems of the world are finally forever solved, and real estate goes up forever. But it doesn’t.
Asset classes are like closed system!
It would be really great and easy if we could observe these cycles like real estate separately, where every asset class is doing its own thing, but that is not the case!
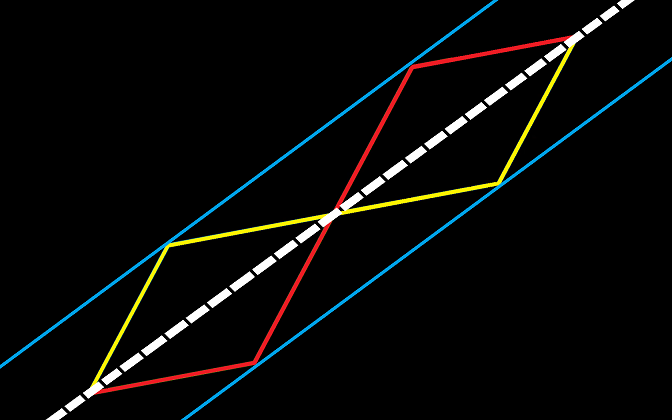
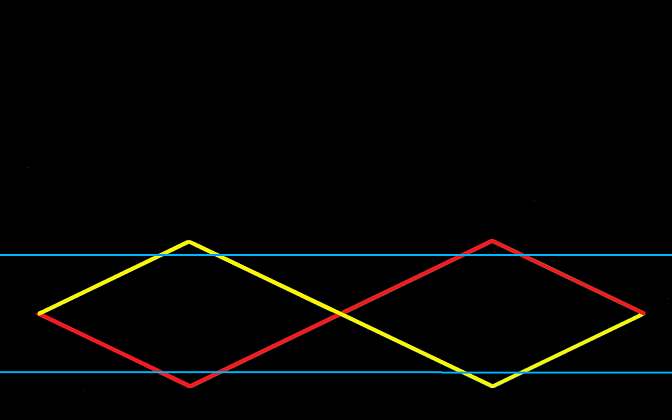
I said in my post about diversification that it is effective among asset classes because markets are system of connected communicating vessels. What happens to one, impacts the others. They are not isolated from each other. It’s a closed system like this:
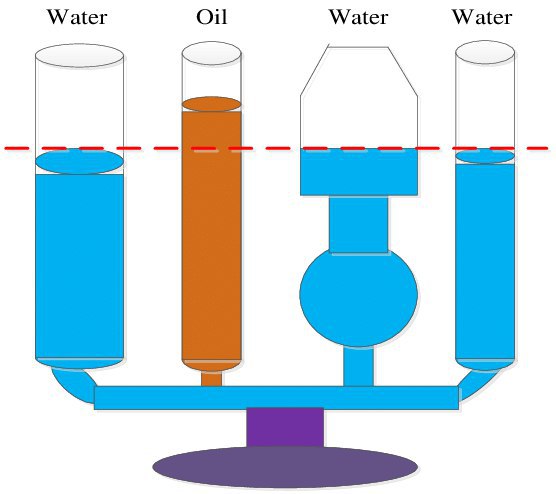
Imagine pushing down the oil, water will rise in other places.
Let’s see now how it all plays out in macro view
What I will show you is based on a real-world example. It’s just a very simple diagram from the 1970s.
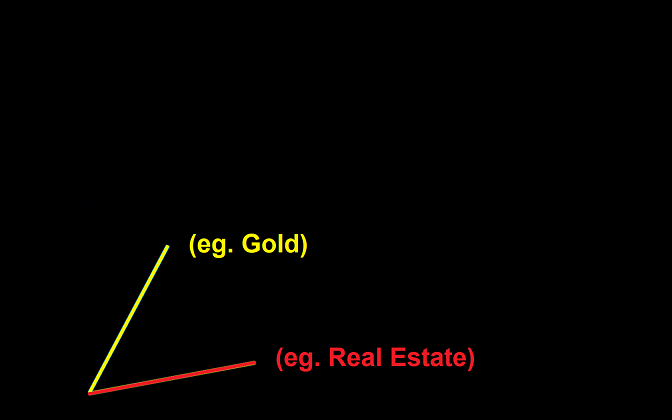
If gold is going up, and if stocks or real estate goes up – it was BOTH stocks and real estate in the 1970s, but I’m using stocks right now because I’ll show you the actual chart of that later… So if gold is going up at a much faster rate, and it did during the 1970s… stocks rose a little bit too, but basically they were sort of bouncing along sideways and going up a little.
If you were invested in gold, if you sold it 10 years later, you could buy many many many times more stocks, or real estate. If you were invested in stocks, if you would have sold it 10 years later, you could only buy a fraction of the amount of gold that you could have if you had you just invested in gold in the first place… Or conversely, just a spent it on food, gasoline, your house payment, a new car, whatever. Stocks did not keep up with inflation during that period of time.
But then, one asset becomes too overvalued, the other one becomes too undervalued, and the cycle reverses, and it did.
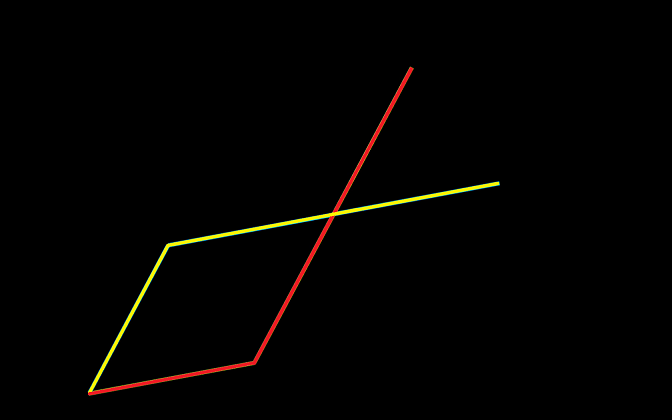
For 20 years gold went down from 1980 to the year 2000, and stocks entered a bull market that was one of the greatest stock bull markets in history until the blow off top of the tech bubble.
Then it reversed again and we’re about halfway through this cycle right now. What’s happening here is they’re printing currency right at about this rate in the middle.
This is the investors rushing back and forth from one asset class to another, but the one that’s underperforming doesn’t actually go down because banks keep on creating all of this currency and some of it goes to all asset classes.
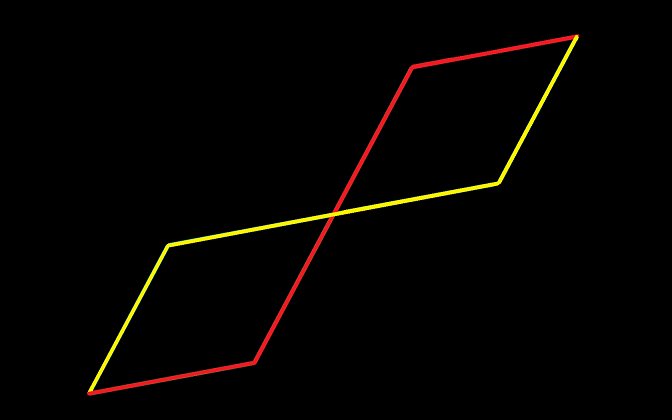
Now take one asset class and divide it by the other asset class. It doesn’t matter which way, which direction you do this – you can take gold/Dow Jones Industrial Average, or S&P 500/gold or your house/gold… or bushel of wheat or pound of copper or ton of iron or oil barrels… What you will discover is that everything is trapped in a valuation range.
You can be invested in one thing for a very very long time, and end up nowhere.
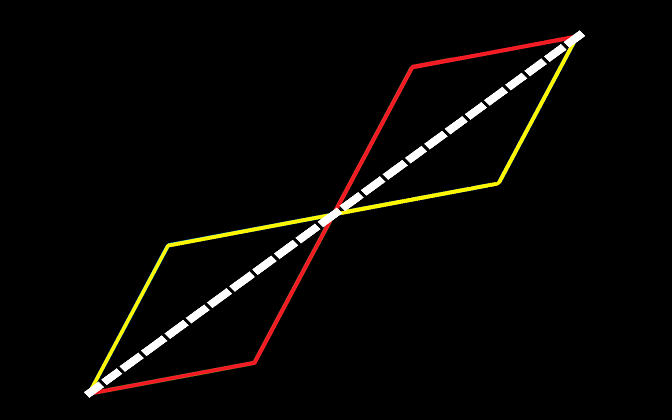
But if you can measure when something is overvalued and something else is undervalued, you can see that because you have to measure it to be able to see it.
The trick is that you can’t see intuitively when something is overvalued or undervalued in this monetary system that’s constantly expanding. People would say: “At least my house is worth a 100.000 dollars more than it was in the year 2000” or, “it’s worth 20% more.” Well, in fact, if the inflation was 40% it actually went down in value.
When you learn to see that, then you can sell the overvalued asset class because it is going into the bubble because no asset class can be outperforming other one forever, and buy the undervalued asset class.
That’s what smart money is doing. It’s like busting these cycles apart and pasting the next wave onto the end of the last one. It is a road to true wealth.
I understand that nobody can catch the exact top of anything, and that these are much longer time frames than most people’s lifetime even. However I just want to show you the immense power of these types of gains that can be made even in conservative markets.
Price vs Value
I often get angry when I hear something like: “This asset grew in value x amount.” I am angry because this is completely thesis replacement, not just inaccurate but dangerous. Maybe asset grew in value, but more often than not, it just grew in price. If it grew in price it doesn’t mean that it grew in value also.
This is something that favors the speculative mindset that majority people have when it comes to evaluating assets. Main difference between investor and speculator is that investor is focused on value, and speculator is focused on price. Here is what I mean.
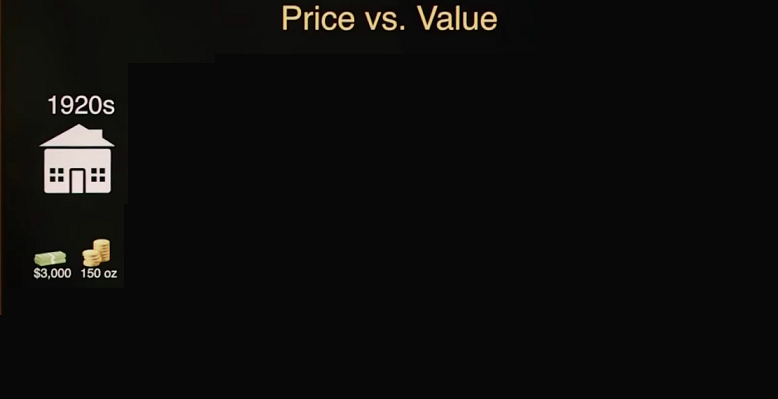
Gold vs Real Estate
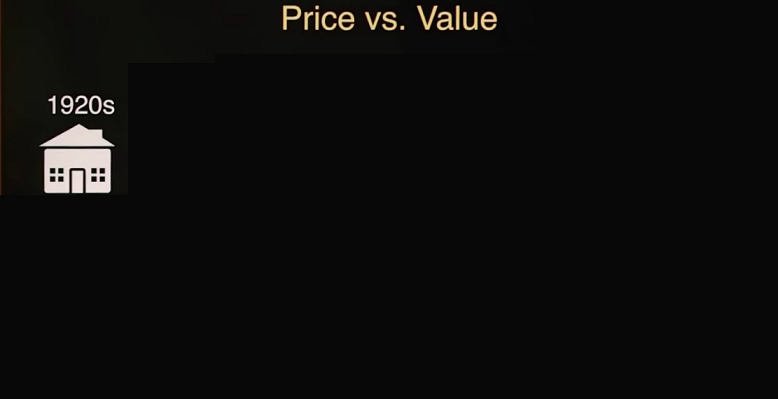
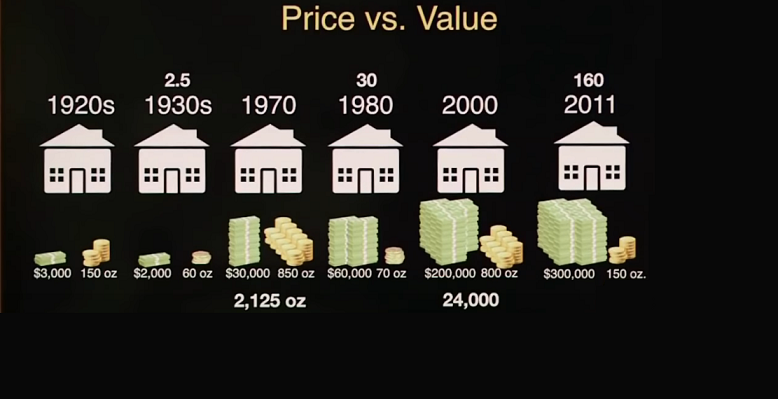
This is in the 1920s a upper-middle class home – nice 4 bedroom large home with a swimming pool in the backyard and a decent amount of land… which was sold for about $3,000 in the 1920s, and Gold was $20 an ounce back then.
So it would have cost $3,000 or 150 ounces of gold. Conversely if you had sold the home, you could have gotten a 150 ounces of gold for it.
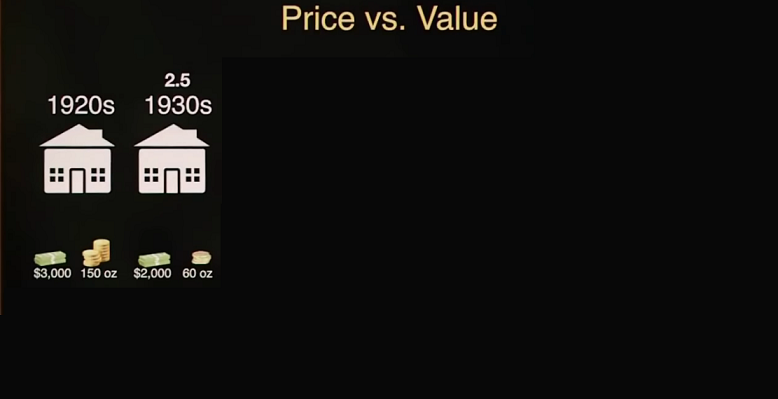
Then in the 1930s… and this could have been between 1928 and 1932, so it’s not very long that you had to wait to see the move. The house fell to $2,000; Gold was now $35 an ounce. That meant that this house only cost 60 ounces of gold.
If you had sold this house and bought 150 oz gold, and then repurchased when it was 60 oz of gold, with ofc transferring cash to gold and gold to cash, you could have gotten 2.5 times the amount of real estate in just those few years!
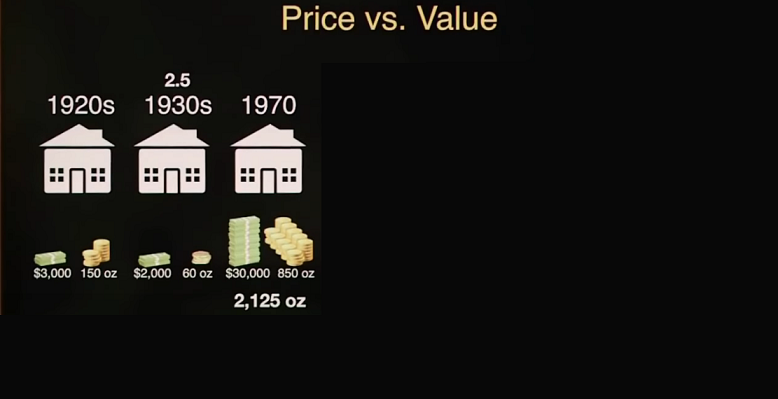
Then in 1970 that house was now $30,000 but gold was still $35 an ounce, so it cost 850 ounces of gold. If you had kept this home, or more precise 2.5 more real estate in the 1930s, and then in the 1970s sold when it was $30,000 or 850 oz of gold… you would have received 2,125 oz of gold.
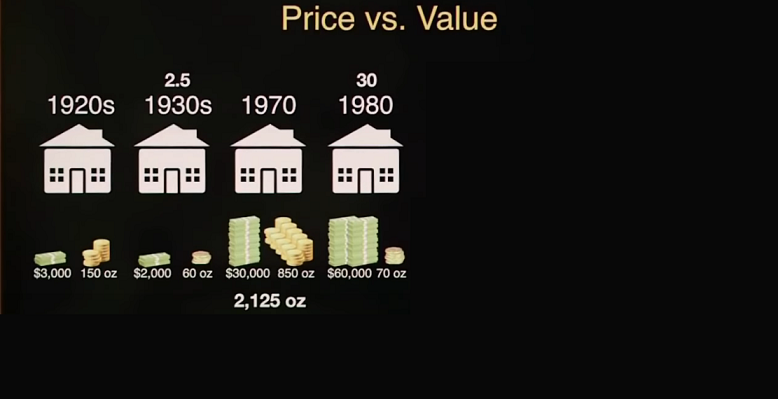
Then just a decade later in 1980, because of rampant inflation, the house was now $60,000 but gold became free trading in 1971 and it went from $35 an ounce up to $850, so that house was now worth 70 oz of gold – house went down from 850 oz of gold to 70 oz of gold during that period of time!
So if you repurchased real estate with your 2,125 oz worth of gold, you would have now gotten 30 (!) of the same type of home that you sold in 1920 so you would now own 30 of them.
In trying to think of an analogy for the performance of gold and silver in the 70s, what comes to mind is a great asset race between stocks, real estate, gold and silver. If those assets were horses which one should you have backed to get the maximum payoff?
Let’s bet $1 on every asset when each asset is at its lowest price of the decade, and then we’ll see what we would have collected when all four assets crossed the Finish Line in January 1980.
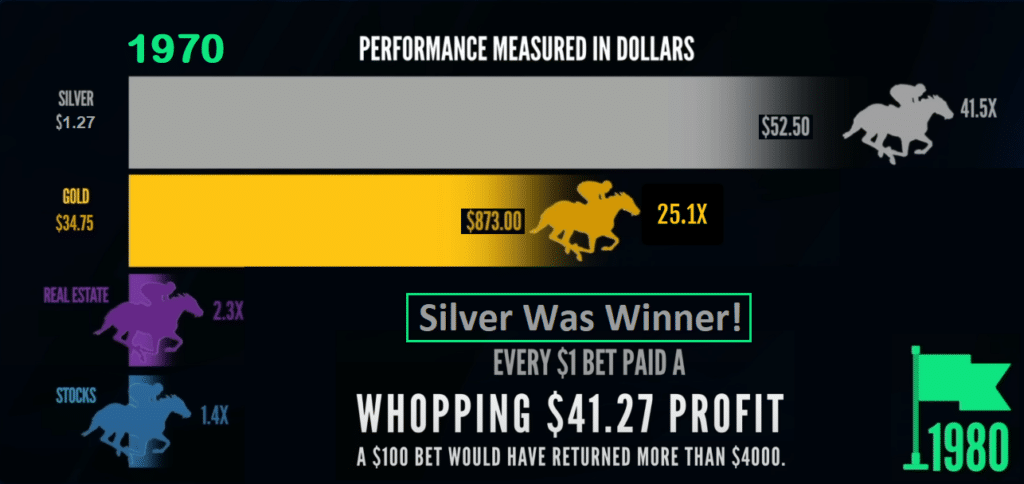
There was a day in 1980 when gold was $850 and the Dow was at 850 points, one ounce of gold bought the Dow. Conversely, if you cash out you could only buy one ounce of gold with the proceeds of your stocks, and then we’re going on to the biggest bubble in history.
There’s no time in history that gold was as unloved and ignored as in 1999 – 2000. It was no nation’s money and it had gone down for 20 years, it was “the worst investment you can possibly make,” nobody wanted it.
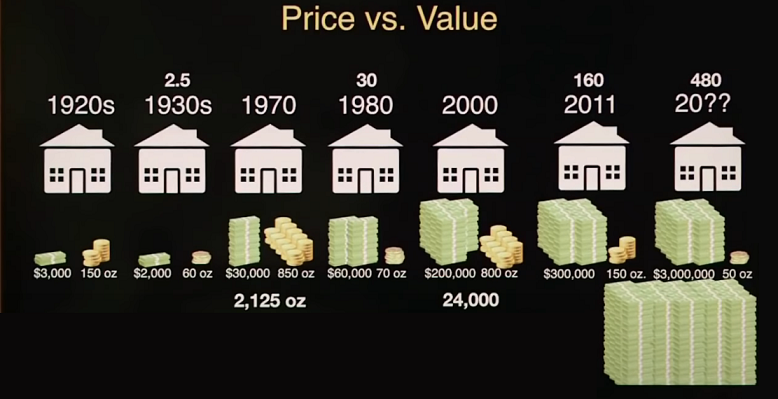
In the year 2000, gold bottoms at $250. That house was now worth $200,000 – same house, the house hasn’t changed, it’s regularly maintained if you are pinpointing. So that house is now $200,000 but gold had gone down so it now cost $800 per oz, and if you sold the house in the year 2000, you would have received 24,000 ounces of gold!!
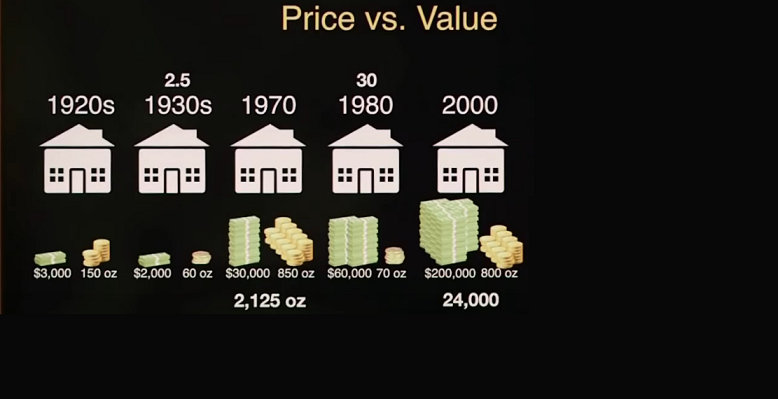
Then in 2011 gold hit $1925 per ounce and the house was now worth $300,000 but it was only worth a 150 oz of gold, so you could have in 2011 bought a 160 homes (!!!) with the proceeds from taking this one home in 1920s, and just going back and forth to different asset classes.
However this cycle isn’t done yet. Gold’s price went from $35 to $200 from 1971 to 1974, and then it went back to $100 to late 1976 and then it took off and went to $850.
We’re basically in that mid cycle correction now, and it’s pretty much over with, and so now we get to see the fireworks of the end of this cycle.
The thing with the cycles is that 80% of gains happens in the last 20% of time. I don’t know when the end is going to be, I don’t know if it’s going to be 2025, 2026, cold be 2027… but I’m fairly confident is that this house will be $3,000,000 because Federal Reserve prints and prints and prints currency which kept going into real estate and the stock market, but measured in gold it’s probably going to be somewhere around 50 oz of gold.
So why are we talking about gold all the time here? That is because gold is oldest and most proven reliable store of value. It shows what is really happening over longer period of times.
Cycles are determined by debt creation because money = debt in today’s financial system. These cycles are determined by debt creation and productivity. Productivity matters most in the long run, but credit matters most in the short run.
This is because productivity growth doesn’t fluctuate much, so it’s not a big driver of economic swings. Debt is — because it allows us to consume more than we produce when we acquire it and it forces us to consume less than we produce when we pay it back.
Debt swings occur in two big cycles. One takes about 5 to 8 years (does recession ring the bell?) and the other takes about 75 to 100 years (does depression ring the bell?). While most people feel the swings, they typically don’t see them as cycles because they see them too up close — day by day, week by week.
If house hits 50 oz of gold as I said, that means you could buy 480 homes (!!!!). Exactly the same homes with which you started with in the 1920s. It’s just the same very trivial investment, just jumping from different asset classes which is the point of diversification.
The gold that you received in year 2000 from selling the house be worth about $45 million worth of gold today in 2023. If you hang on to it and bought real estate, this is about a billion dollars worth of real estate, which means that you have gone from $3,000 to a 1 billion dollars in 100 years!
This sounds absurd, but these are just numbers. This is an exercise on what is a wealth cycle and how big is its power. This is the maximum power, you’d have to have a lot of luck for this, but still you can catch quite a bit of this wave just by looking at numbers and making the right decisions.
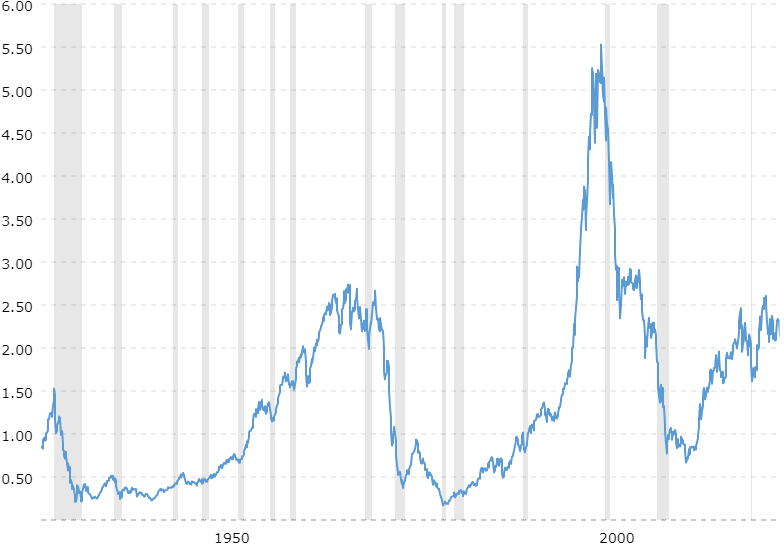
Gold vs Stock Market
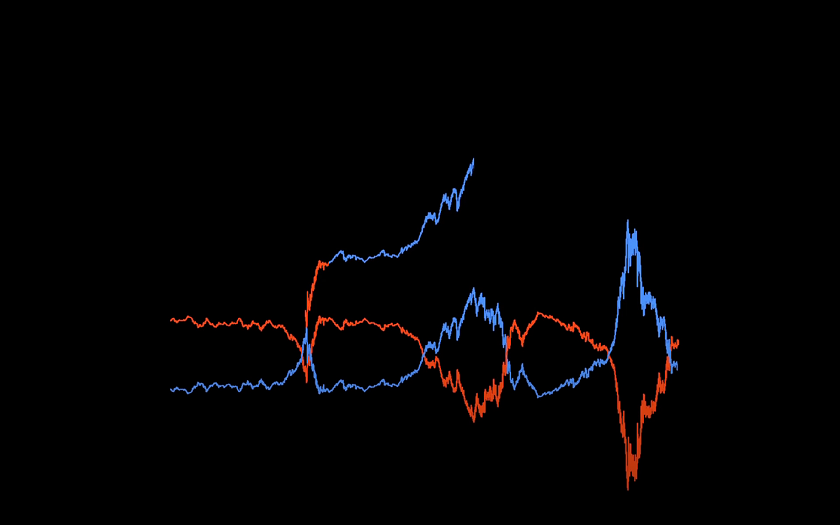
Now I’m going to show you a real world example of the Dow Jones Industrial Average.
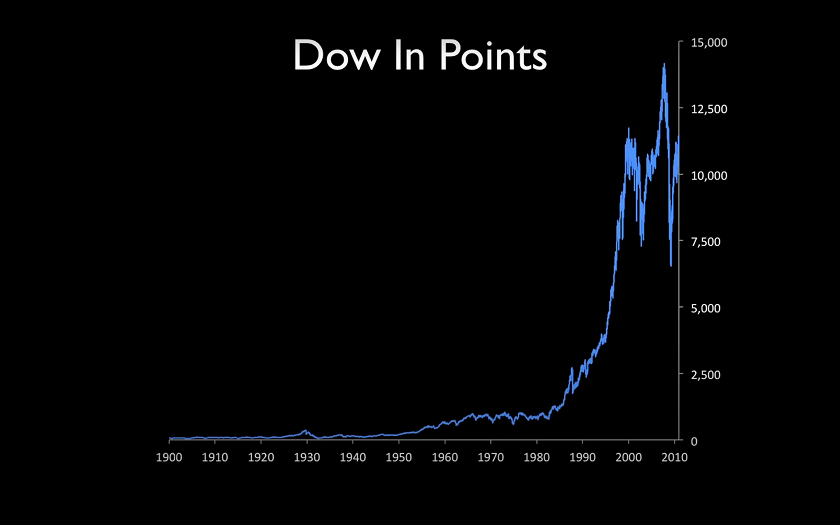
This is Dow measured in points. And what are points? Points are derived by the dollar value of the underlying stocks, so basically it’s points are dollars, and one of the reasons that they measure it in points is just like when you go to Las Vegas, they take your currency and they give you chips. They’re pieces of plastic, so you don’t care, you’re just having fun. So change it to points, and it’s not as bad as if “Wow, you lost so many dollars,” but “it went down so many points.”
This is a fairly old chart, it would take several days if not a week to update this presentation to today’s prices and everything, but I’m teaching a concept here.
If you go every month during this entire graph from the year 1900 to today, and each day you take the points on the Dow and divide it by the price of gold, you get how many ounces of gold one share of the Dow is worth, and this is what it looks like measured in gold:
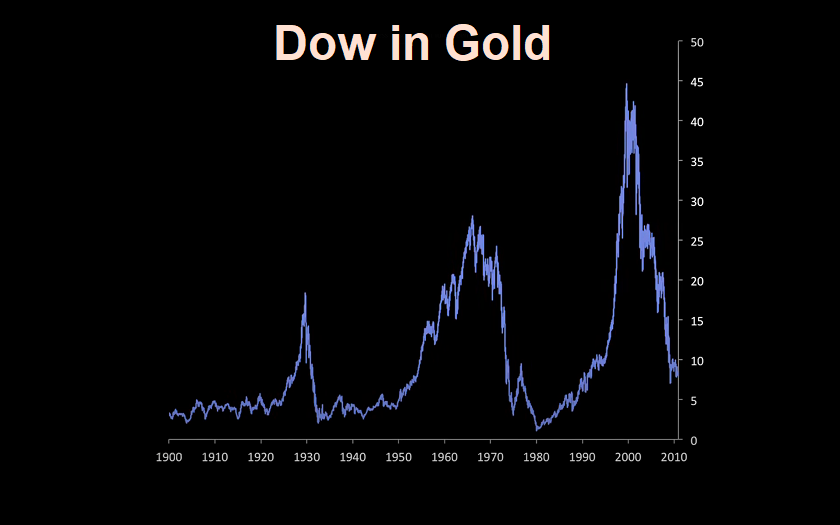
What you see is that it’s going nowhere. It goes up and down, but there’s a mean of about 4 ounces of gold, which means that the price of gold should be one quarter of the points of the Dow and then things will sort of be in equilibrium.
It’s fair value when the Dow is only four times the price of gold, but what you see here is that it goes into, it goes from fair value into a bubble 18 ounces of gold, it crashes down to 2 ounces, another bubble of 28 ounces of gold because the bubble was bigger, then it crashed and went down to one ounce of gold. The bubbles are getting bigger because banks keep on creating more and more and more fiat currency.
Mean is an average that it goes through, it’s going to return to that, and it’s probably going to overshoot. And when it does, I think that this is one of the greatest opportunities presented to anybody in modern times, and I sort of see this as an inevitability.
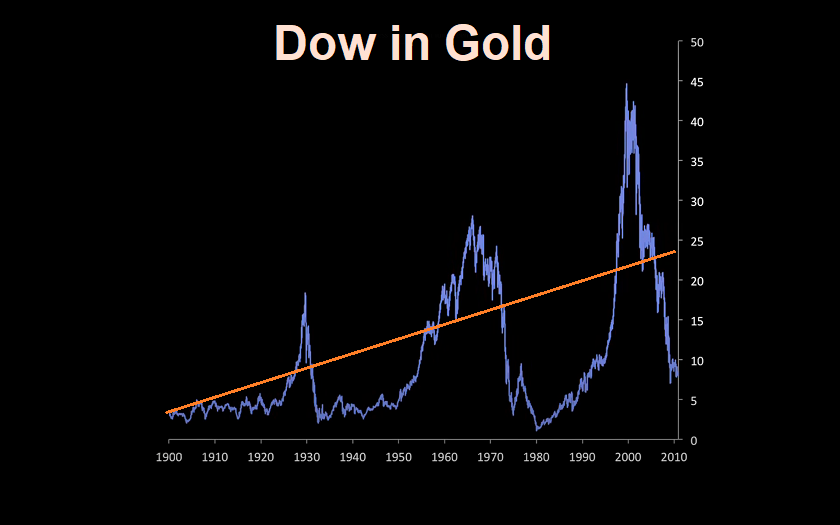
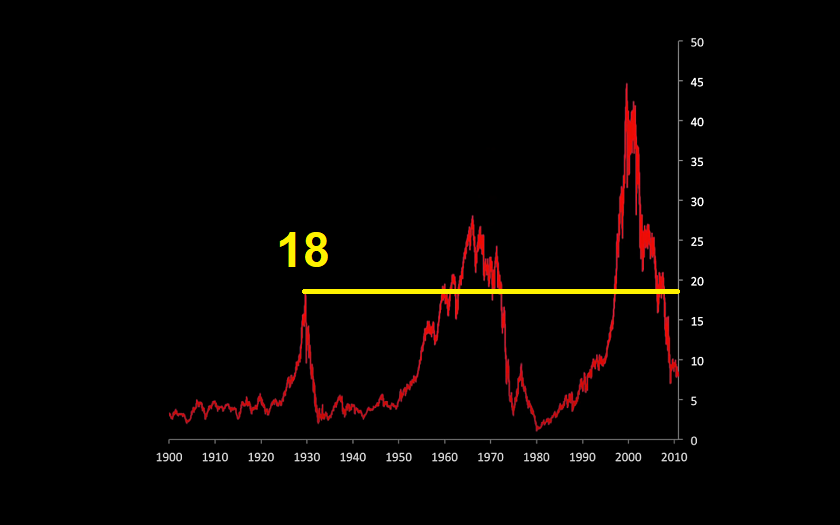
The main point I want to demonstrate is that if you ride just one asset class, you potentially get nowhere over a lot of your lifetime. If you had invested in the Dow in stocks in 1929, right at the peak of the stock market bubble, it would have cost 18 oz of gold to buy one share of the Dow.
If you held on to it for 89 years those stocks and sold them now, you could buy 19 oz of gold. Your return for the whole eighty nine year period was 5.6 percent, and there were periods during this time when we had raging inflation.
In other words you didn’t go anywhere. You were invested your entire lifetime and you didn’t make a gain.
You can see that there’s sort of a cycle here, actually 3 cycles.
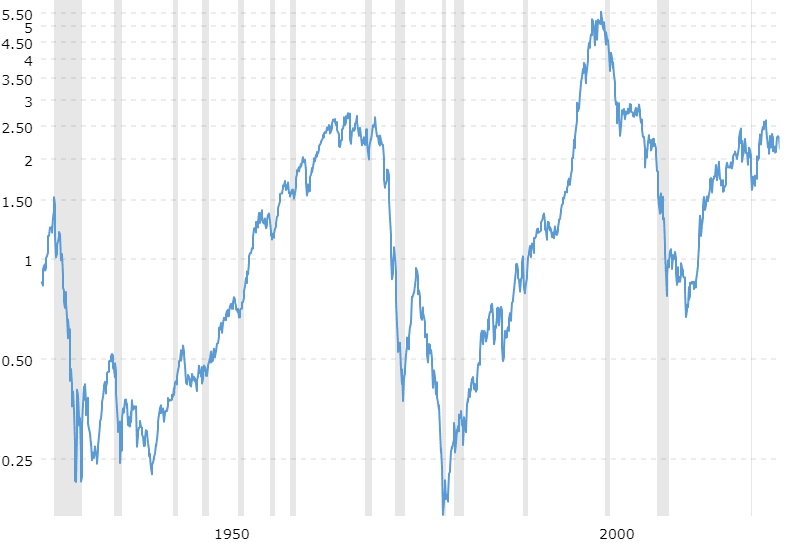
But if you really want to see the cycle, this is the Dow measured in price of gold. But if you take gold priced in the Dow, you get this chart:
Overlay that with the Dow priced in gold, and now you can really see a cycle:
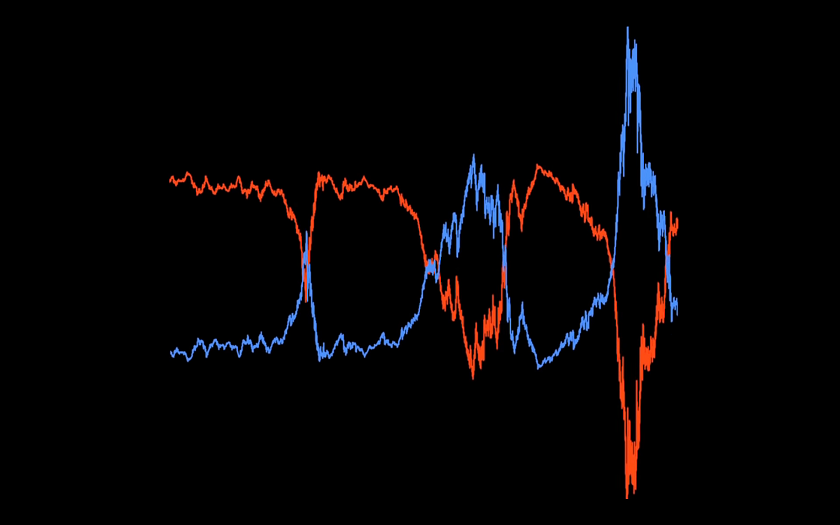
That is just a perfect cycle that you can jump in and out of, but you only have to make a few decisions in your entire lifetime to be an immense winner.
If you had invested in stocks and you ride them up, and sell and buy gold, and measure to see when gold is getting overvalued and stocks are undervalued again… then go back into stocks, and then back into gold, and then back into stocks, and back into gold.
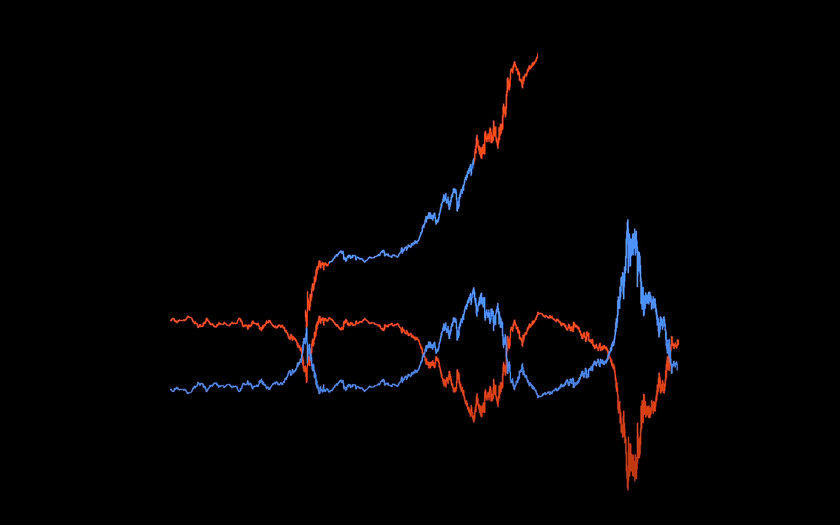
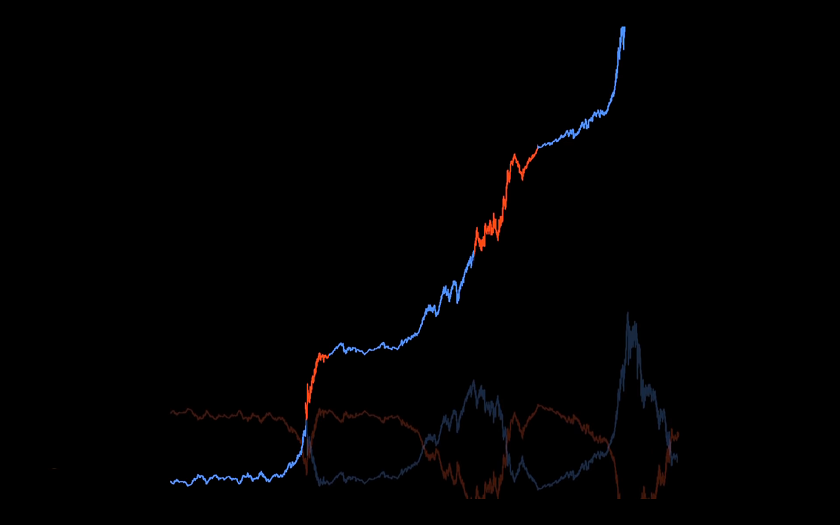
If you had invested back here in 1903 just $30 in stocks and did this technique, $30 would have become $15,000,000 in 2010 when gold was $1350 per ounce. That is the difference, one family creates a dynasty the other one didn’t even break even.
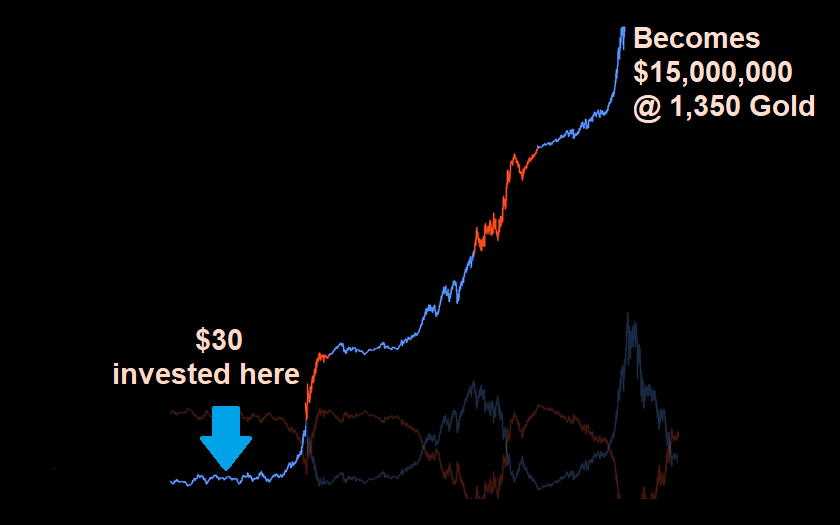
Again, it is almost impossible to catch the exact peak and the exact bottom of everything and to have perfect timing, but it just shows you the immense power of this. If you only catch one or two of these in your lifetime, there’s still immense gains that you can make, and you’re escaping valuation channel.
That is the most important thing – getting out of that valuation channel and actually going somewhere.
The total maximum that you could have achieved here is 50 million percent return! That's unheard of. That would also have taken three generations, this is more than a hundred years - we're talking about 1903 to the year 2010.
This is the difference between price and value – home went up in price constantly, but the value measured in gold went from a 150 to 60 to 850 down to 72 then risen to 800 and then down to 150… so it was bouncing in that valuation range that I was talking about.
S&P 500
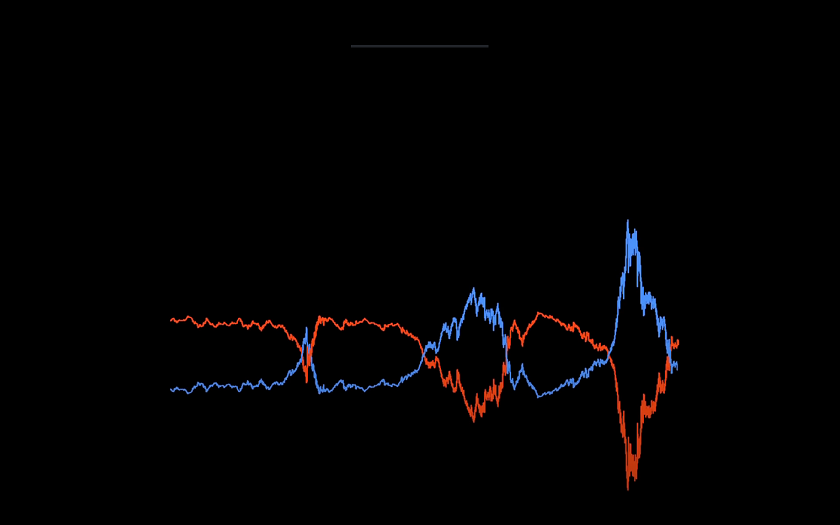
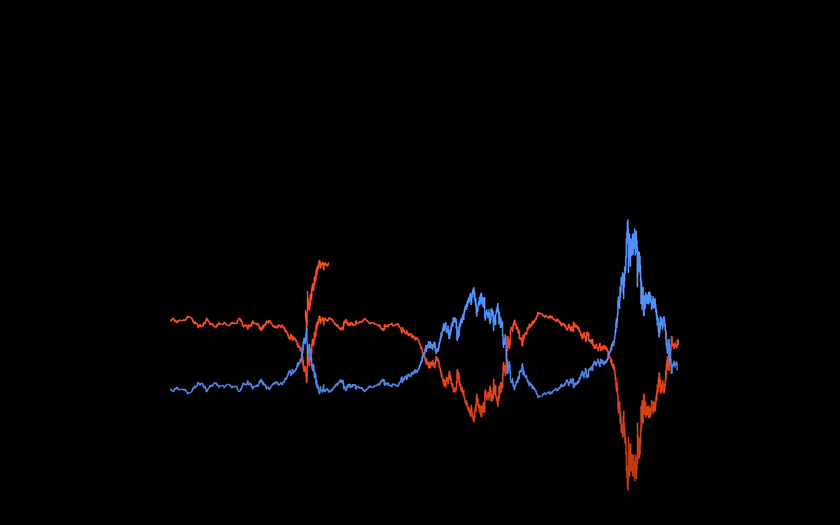
Let’s make that valuation range on S&P 500 which is stands for “The Standard and Poor’s 500” which is a stock market index tracking the stock performance of 500 of the largest companies listed on stock exchanges in the United States. This chart which you can track live represents gold divided by the S&P 500:
Showed in logarithmic scale it looks like this:
This is exactly same chart, just turned upside down and 20 years longer in the past:
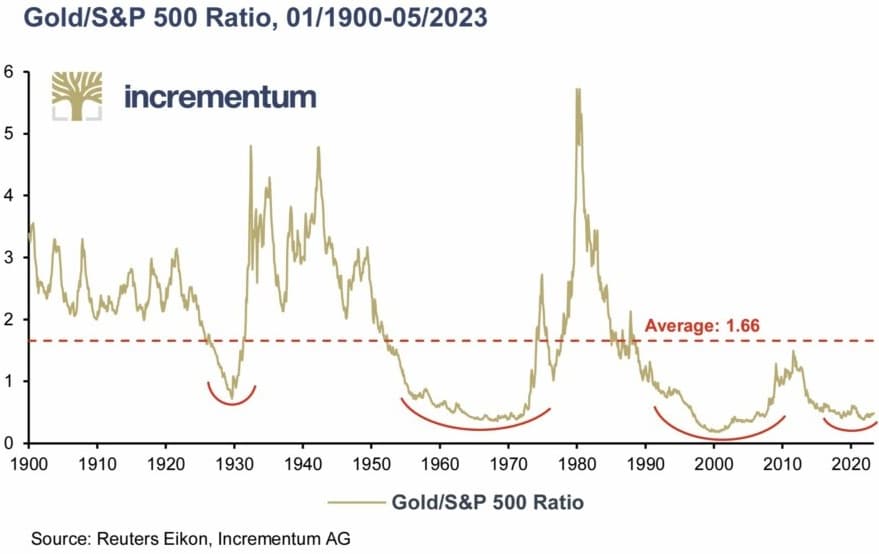
What this chart shows you is when is gold undervalued or overvalued in comparison to stocks on monthly averages (traders go away!). When it’s below the line toward the bottom, stock market is overvalued and gold is undervalued. When it’s toward the top gold is overvalued, and the stock market is undervalued.
As you can see once every several decades market tries to snap back and tries to go into balance, but it releases all stored energy because this financial system is centrally planned and controlled, and then overshoots and that is when we end up with these enormous gains in one asset class (in this case precious metals).
But what this chart is revealing is that it looks like that there is natural Balance in equilibrium where an ounce of gold would buy you 2.5 shares, or whatever the points are on the S&P 500. At least that was the case until 1950, from which it went lower so the total average is 1.66, and now we are at around 0.5.
We can debate if it is still 2.5, but that’s not that important because it overshoots anyway, and for the last 25 years energy is accumulating down there. You can see accumulation phases in red, but this last one didn’t overshoot for real because Central Banks were trying really hard to fix the current problem, and as a result problem became even bigger, and now they have much less ammunition to fix the problem it is now occurring (in late 2023).
Little history and context
Up until 1950, there was a natural balance within a more rigid monetary system based on the gold standard. This equilibrium was characterized by a delicate interplay between the stock market, the value of stocks, and the value of gold.
On December 23, 1913, the Federal Reserve was established, and the United States engaged in significant deficit spending to bolster World War One efforts. Following the war, the country experienced a substantial deflationary period known as the Depression of 1921.
However, during this time, expansionary policies, including initiatives like bankers’ acceptances, were introduced under the oversight of the Federal Reserve. There were also measures taken within the banking sector itself.
This resulted in a significant increase in the money supply as Central Banks tried to fix problem in economy, ultimately leading to the events of 1930’s. This expansion that did not cause retail inflation; it caused asset inflation.
Well, what has happened for most of this century in the United States?
We’ve had this big inflation in the stock market and in real estate prices and some other assets, but we haven’t seen a lot of retail inflation until the government started sending checks directly to the U.S. population, particularly after the COVID-19 pandemic.
It was then that we finally saw retail inflation, as the expansion of the money supply always causes inflation somewhere. It can inflate savings; it can inflate the stock markets; it can inflate real estate; or it can inflate commodities and retail prices.
We are now in a transitional phase where, despite the current contraction of the money supply, there has been so much currency created that as some of that leaks out, it’s going to cause commodities (so food and energy and so on) to rise along with gold.
The shift away from the gold standard ushered in a period of economic imbalance. The “Roaring 20s” saw soaring asset prices while the price of gold remained fixed. The stock market crash of 1929, followed by the banking crisis, led to the devaluation of the U.S. dollar against gold, causing its value to surge. This trend continued during the deflationary Great Depression.
The Bretton Woods system was introduced, which slowly came into effect, accompanied by a constant expansion of the currency supply. However, the price of gold remained fixed at $35 an ounce. This arrangement persisted despite the currency expansion during various events such as the Korean War, the Vietnam War, and Johnson’s Great Society.
After Nixon took the United States off the Bretton Woods system, the world shifted to the global dollar standard. It wasn’t just the US dollar; the rest of the world was tied to gold through the US dollar. When the peg to gold was severed with the US dollar, it affected the entire world. During this time, the stock market appeared to be moving sideways. The Dow index struggled around a thousand points in 1966 but didn’t break out until 1982. Some parts of the stock market remained relatively stagnant.
This phase coincided with the remarkable rise in the price of gold, making up for all of this suppression and currency creation. Subsequently, we had currency creation spilling over back over into the stock market, and gold reaching its peak.
In 1980, according to Incrementum’s chart, an ounce of gold was priced at 6x the value of points on the S&P 500. Today, it’s approximately 0.5 times.
If it were to return to that equilibrium, it could potentially result in a 12x increase for gold investors. However, I believe that gold’s value is likely to rise even further due to the substantial stored energy accumulated over the years as a result of various economic policies (that last two red curved lines). This is just currency creation, and this is, we going from regular (Keynesian) economics to Bernankenomics.
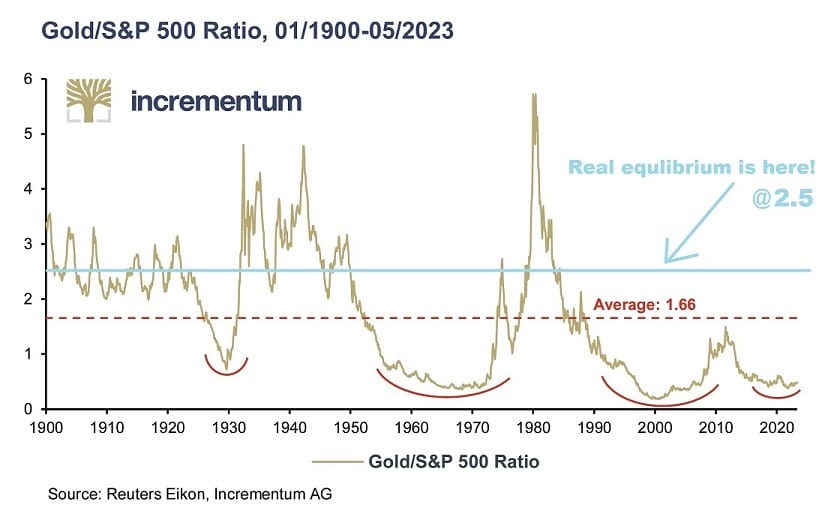
Ignore that red dotted line; that’s the average as calculated by a spreadsheet of all this data. That’s equilibrium calculated under a fixed monetary system, versus a phony baloney fiat currency system that can cause these massive bubbles and disequilibria.
Real equlibrium is not at 1.66 but at 2.5 the value of points on the S&P 500.
For maximum historical context, we can look at the point when gold reached $873 instead of $600, which is nearly eight times the earlier ratio. Currently, it stands at approximately 0.45.
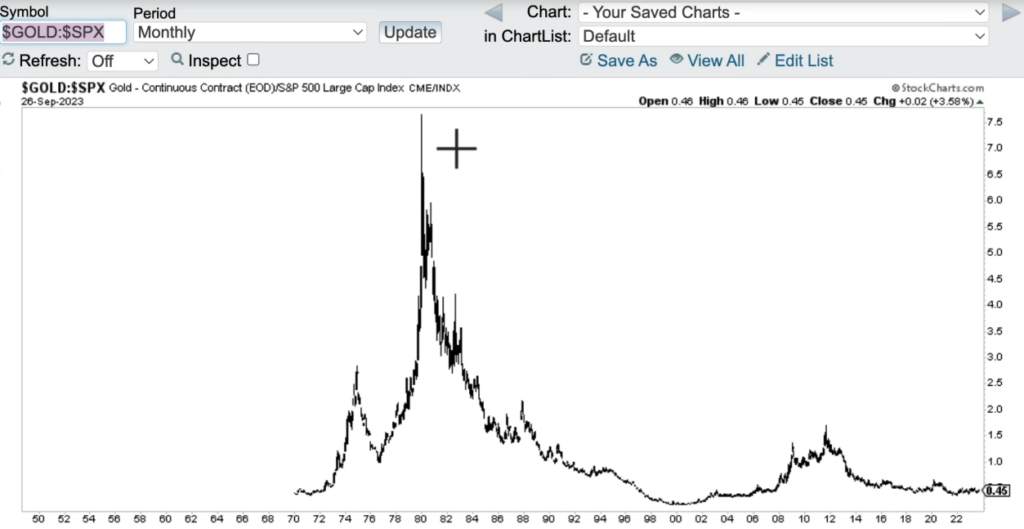
A simple calculation: 7.75 / 0.45 = 17.22 suggests that investing in gold now may yield 17 times more shares of stock when compared to the past. Now, this doesn’t mean that gold will just shoot up (which it will), but this 17x (if history repeats similarly) will come as a result of also stocks going down. So stocks down, gold up, that’s how gold can suddenly buy so much more stocks.
Moreover this time, the potential for increase is even more significant due to the massive amount of stored energy accumulated since the 1995. Just look at the second half of this black chart, and you will get what I mean.
This is why I believe it’s gold’s time to shine, underscoring its enduring value throughout history.
But what about Bitcoin?
What is the connection of Gold with Cryptos?
At the end, let me tell you why I used gold here. Simply, gold is ultimate store of value, and many think that bitcoin is better gold, gold 2.0, and that bitcoin is even better hedge against inflation, bad economy and financial crisis.
Cryptos are new asset class, and I am not convinced that they are here to replace gold or something like that, but they have many similarities with precious metals. After all, it is not about specific asset, but about asset class(es). You can do this with any asset class, it just happens that gold and stocks are growing in shifts.
Why is crypto following stocks? We witnessed simultaneous drops and rises bitcoin with stocks. It looks like to me that this is happening because of the trading bots, and people who put them to trade cryptocurrencies are not very smart about cryptos. So they “told” bots to sell bitcoin when Nasdaq falls, and these same bots are selling all “altcoins” when bitcoin falls.
This is because those traders are not good at looking fundamentals, but technical analysis, and since they are not smart about cryptocurrencies, in their heads they are just like high risk technology growth stocks. And they are not far from that tbh.
And tech stocks are today most likely around the peak of the bull market, or in a bubble. I think that because the S&P 500 technology sector’s relative strength versus the broad market is at its highest level since March 2000.
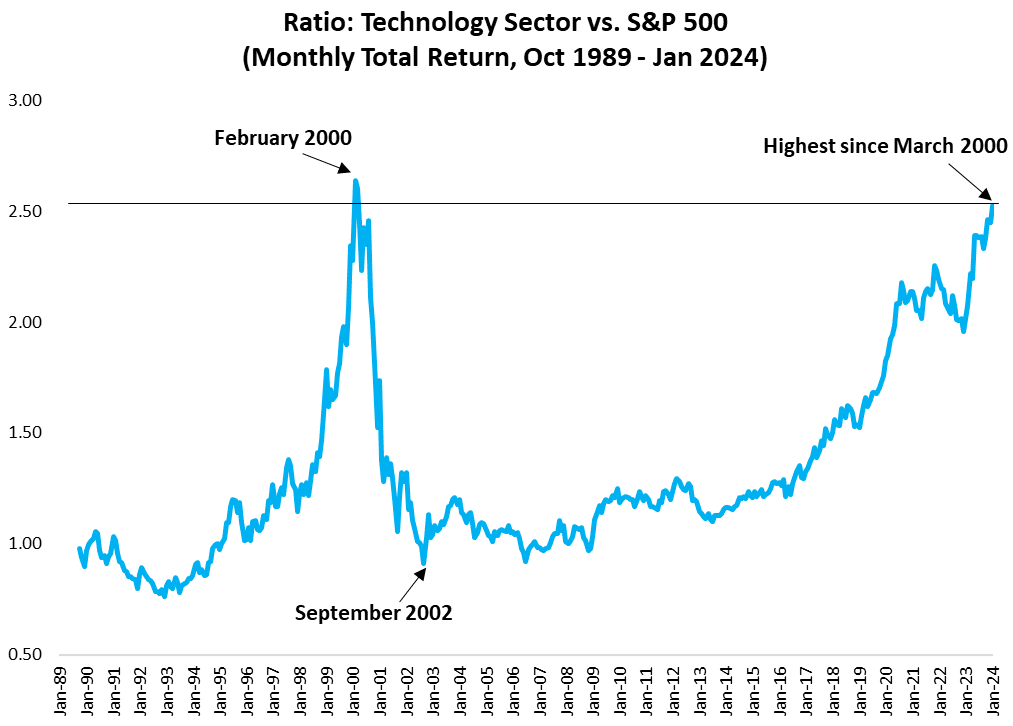
S&P reached All Time High in the beginning of 2024, but thanks to only Technology sector.
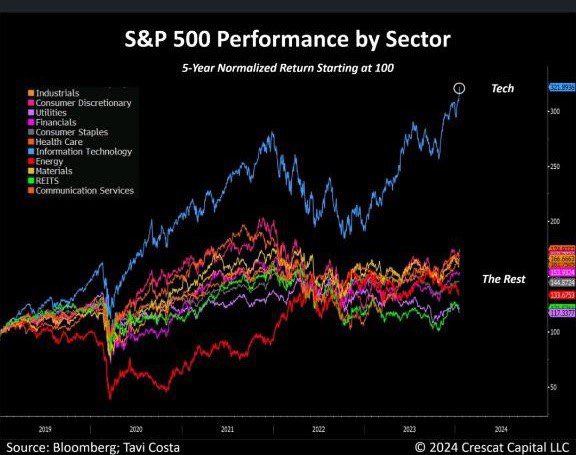
The thing is, cryptocurrencies existed so far only during the economical expansion, which favors the risk assets which are the technology growth stocks, and cryptocurrencies – the riskiest asset class on planet right now. Because technology sector is in bubble, cryptocurrencies can’t be far from it imo.
Let’s look at the cycle charts I like to watch and apply to cryptocurrency markets, not because traders are trading cryptos like tech stocks, but because that has most sense to me.
Remember the “dip” from the real estate chart? We have it here too, it’s called “Bear trap”:
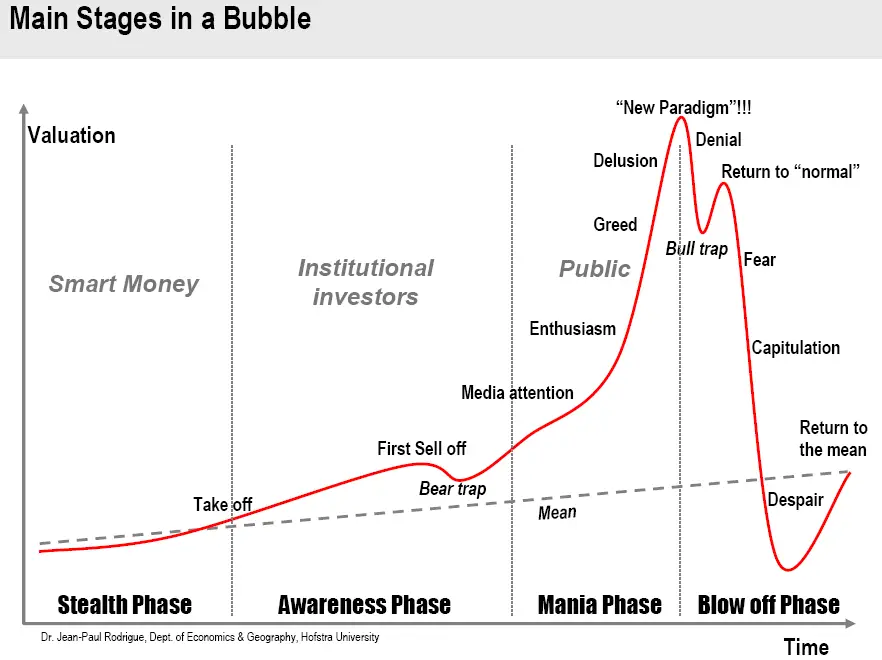
This is self-explanatory what is happening when, and in combination with identifying the emotions of the herd here, pardon me crowd, pardon me market to figure out in which part of the cycle we are in, I can with decent probability determine in which part of the cycle we are in.
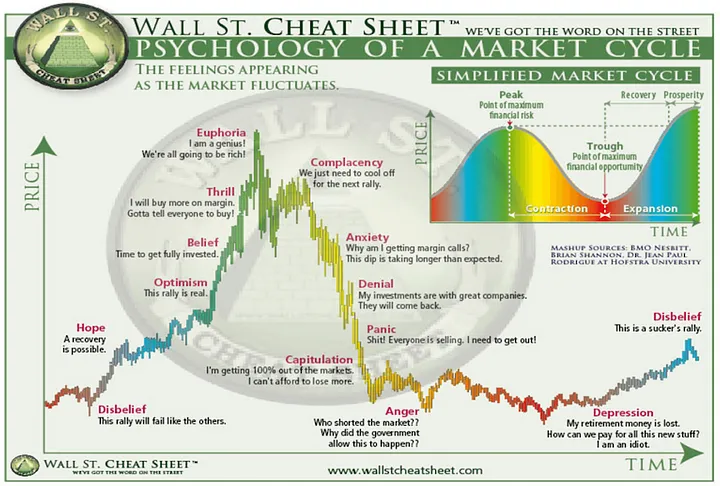
And because crypto is boom or bust, nothing in between, these two charts are really good representation of what is happening. Of course don’t try to time the market and pick exact peak and exact low. Trend is your friend, be bull in the bull market, and be bear in the bear market.
Easier said than done I know, because in bull markets, investors are blind to the risks; and in bear markets, investors are blind to the opportunities.
So just ask yourself, how are you feeling? How are others feeling? Where are we in the cycle of the asset right now, and that is almost everything you need to guess right. But make educated guess 😜


Add Comment