
This is not something very important, but my obligation is to explain you what this is about when you hear or read from bitcoin maximalists. It is just another way of shilling bitcoin imo, and it became a trend in 2019, and after that I don’t see that anyone is mentioning it. But who knows, maybe during the next crypto bull run such things emerge again.
This concept should help you understand how the scarcity of bitcoin helps with driving the value over the long term. This gentleman plan B came up with a model for valuing bitcoin based on something called the „stock to flow ratio“ where essentially the stock to flow is stock divided by flow, stock meaning the existing stockpile of any particular resource or asset (in this case bitcoin), and the flow is the yearly production – or in other words the flow is the amount on an annual basis of new inventory that’s added to the existing stockpile so to speak.
There is also one more somewhat important aspect to this topic and that is lost bitcoins, but I will not going into that now because it would make this thing more complex unnecessarily.
The basic idea behind the stock to flow ratio is that the lower the annual production of something is relative to the existing stockpile, the higher the stock to flow ratio it has, that makes it a better store of value.
The higher the stock to flow ratio, the less you have inflationary effect that dilutes the value of the existing stockpile, when you just have all this flow coming in every year. Btw this is what gives existing fiat money value – existing and used currency before new supply comes into circulation supply.
If something with an annual flow of 4%, meaning that every single year you have roughly a 4% addition in terms of flow, that’s only half as good as something that only has a 2% annual flow.
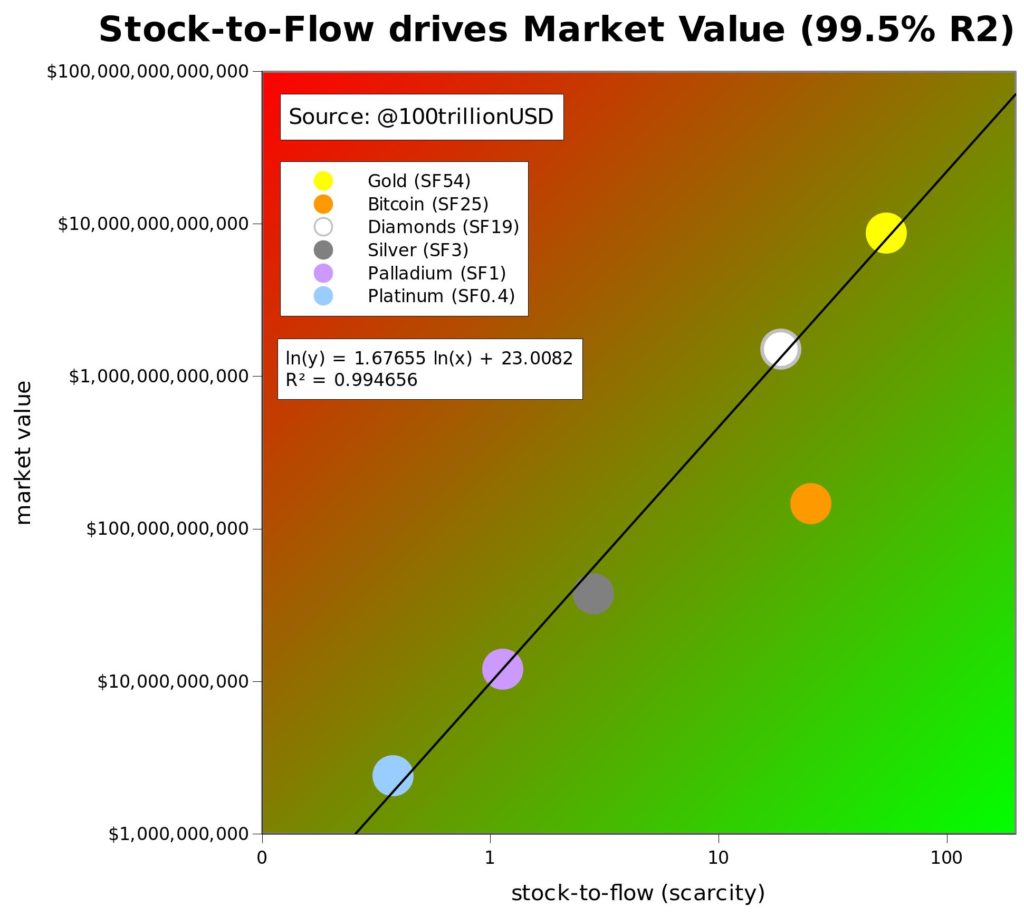
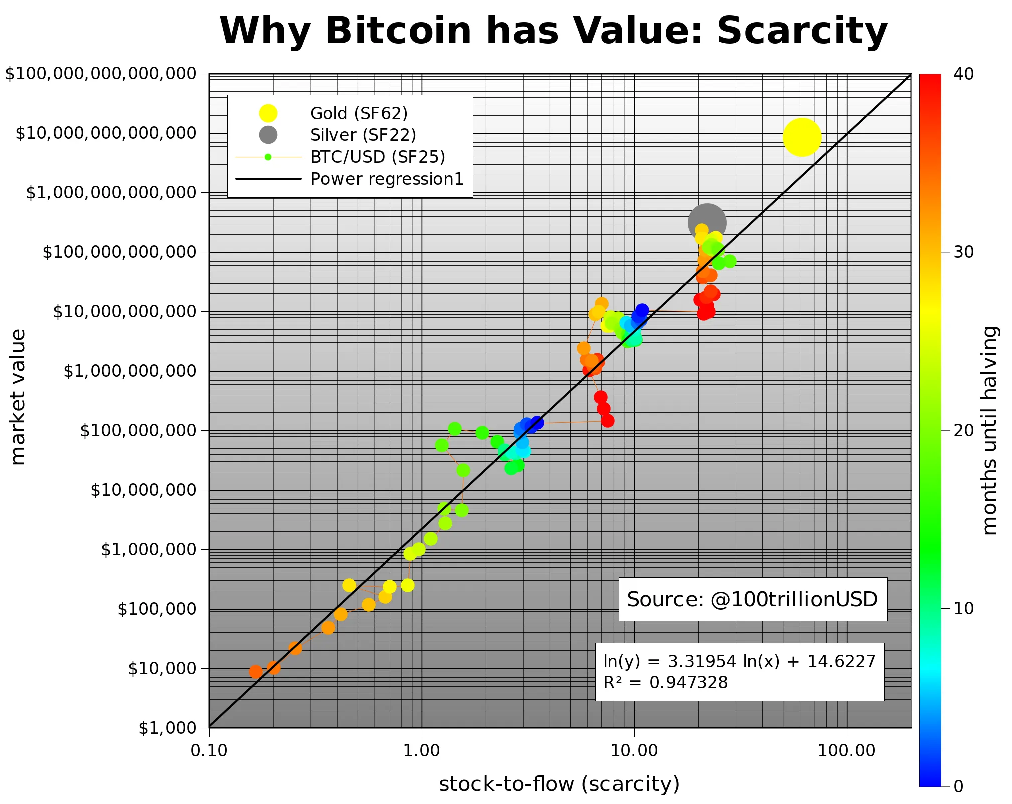
If you were to take something else like gold, another asset which is often used as a store of value, it has right now a stock to flow ratio of 62, meaning that it would take 62 years of production to get to the current gold stock or stockpile.
Silver only has a stock to flow of 22, meaning it only takes 22 years to reach total amount of all existing silver.
This stock to flow ratio is one of the reasons gold is considered to be a much better store of value than silver, and this is why more people store more of their wealth in gold as opposed to silver.
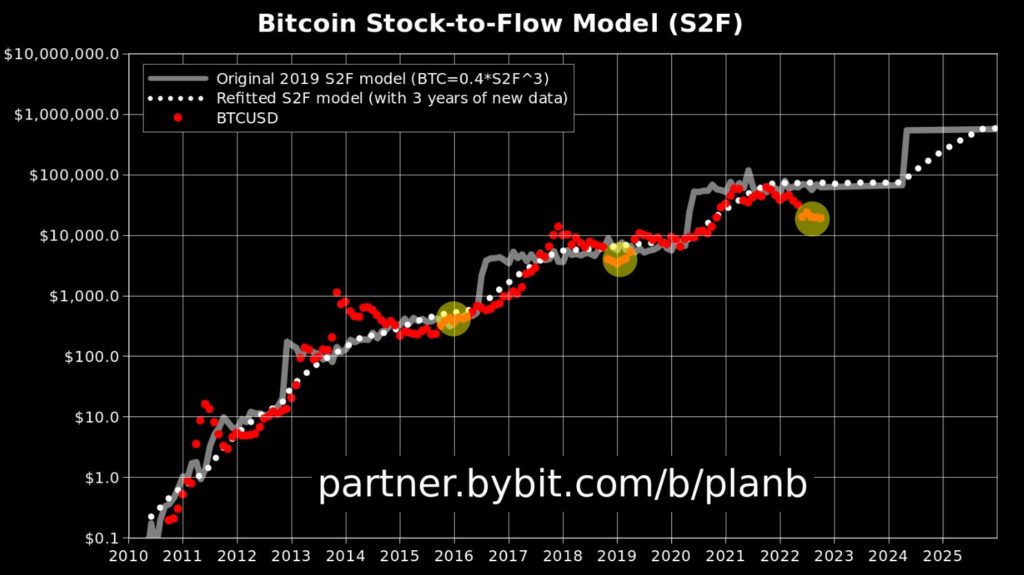
Here you can find the latest most updated version, I posted under how it looks like at the moment of writing.
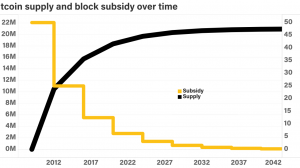
Now let’s run the same data on bitcoin. Right now stock to flow of bitcoin is 55, so better than silver but worse than gold by a decent amount. That is because there are 19.33 million circling supply of bitcoins, divided by the annual supply which right now is 328.500 bitcoins per year. This is because there are 6.25 new bitcoins added into circulation per block which is on average 10 minutes, which means that it is 6.25 x 6x 24 = 900 new bitcoins coming into circulation each day, 900 x 365 = 328.500.
But the crazy thing about bitcoin and what differentiates it from pretty much all other kind of commodities and precious metals out there is this event called the „halving“ which takes place every 4 years for bitcoin, where every 4 years algorithm cuts new issuance rate by 50% or what is called the flow.
Implications and thoughts (shill) goes in the direction that if we have these precious metals like gold that have higher structural flow ratios and so attract much larger investors, then Bitcoin will attract same type of investors. Bear in mind that the total market capitalization of gold is over $13 Trillion.
Conclusion is that the higher the stock to flow ratio, the higher the value. And because of Bitcoin’s halvening and ultimately limited supply, Bitcoin is going to be exponentially more valuable because it’s stock to flow ratio will be increasing significantly.
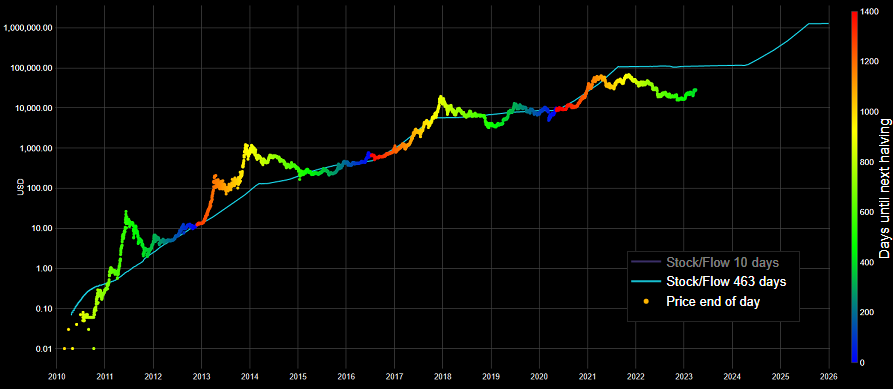
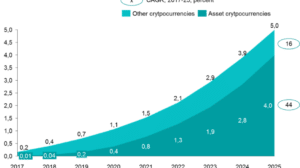
Here you can see how dramatically the price of bitcoin and other cryptocurrencies could rise just over the next few years and decades.
If you’re wondering how reliable or how likely this is, if there are any math out there, Plan B claims that this model has a 95% R squared (95% R2, significance of F 2.3E-17, p-Value of slope 2.3E-17) which means coefficient of determination, which in other words means that the odds of this being wrong or just coincidental so far if you look at the history of price movements and compared to stock to flow and look at other assets as well… the odds of this all being completely wrong, being completely correlation is very very low to say the least.
Check out his medium post if you want to explore more this modeling of bitcoins value with scarcity, to gain a greater understanding of how Plan B is coming up with all these conclusions and coming up with all this dana.
What is my take on it? Not much. Concept explained in order to wow the noobs. These folks will push whatever narrative goes into the “shilling Bitcoin” direction. As you can see on latest updated charts, in 2022 this model failed, and that is probably the most important reason why we are not hearing about this in the crypto space lately.
But if Bitcoin goes back on the previously forecasted trajectory, I am sure that Bitcoin maximalists will be jumping around with this chart which will be supporting the thesis how Bitcoin is the best thing ever, and how right now is the best moment for you to buy one.
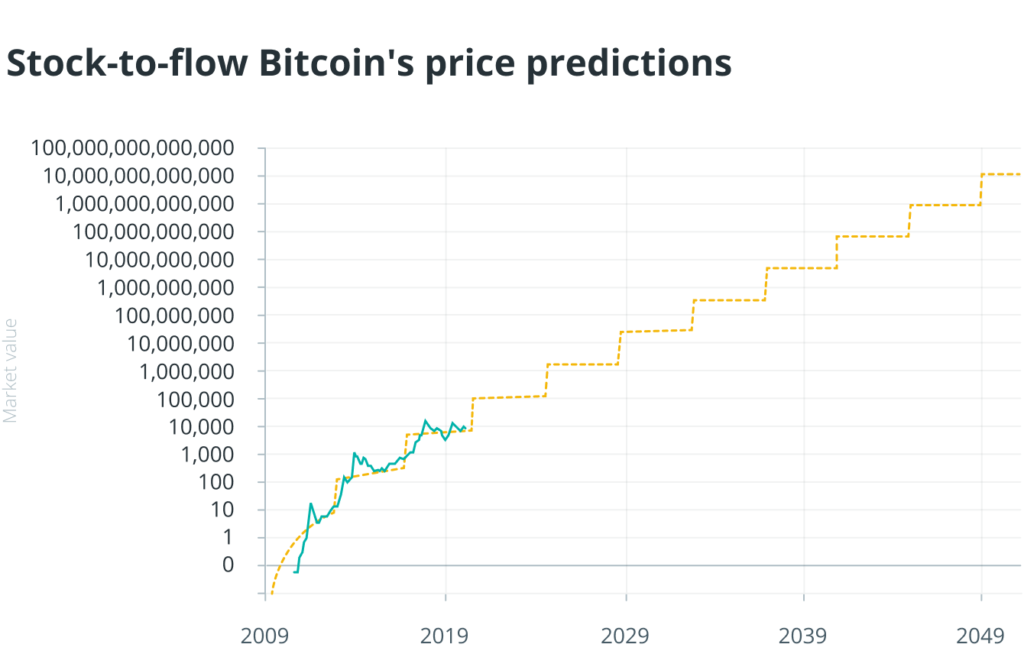
I bet that they will be sharing something like this lol
By this chart, price of bitcoin will reach $1 million by 2029 and $1 billion by 2039.


Add Comment